Mobile App
The BME AI-Studio Mobile App lets you connect to the BME688 Development Kit, record label data on the fly and live-test your algorithms in the field.
Connecting to a Board
The Mobile App connects to the BME688 Development Kit using Bluetooth. The home screen of the app is the My Boards screen, which is a list of all your boards. Let's start by adding a board to this list. Connect your board to power and select Add new Board. The app will now search for available BME688 Development Kits nearby. Select your board and give it a name. Select Add Board.
Your Board is now permanently saved in your list of boards. From here, you can easily select Connect to establish a Bluetooth connection from the app to your board. If needed, you can add additional boards to your list.
If the app does not find your board, please make sure to ...
- connect your board to power and ensure it is running
- enable Bluetooth on your smartphone
- allow the app to use of Bluetooth, when asked; if you denied Bluetooth usage by mistake, please go to the system's settings of your smartphone and allow Bluetooth usage for the BME AI-Studio Mobile App or reinstall the app.
Please note
Once you connect the BME688 Development Kit to power, it starts recording gas data immediately. This is done intentionally so recording can be done without the need to install the BME AI-Studio Mobile App.
If you connect to a board using the app, the current recording will be stopped temporarily, and resumed once the app is connected.
Two modes of Operation
Once you connected to your board, you can choose between two modes of operation:
Record & Label Data You want to record raw gas sensor data with the BME688 Development Kit and label your different specimens on the fly. For this mode you need a board configuration file (
.bmeconfig) on the SD card.Live-Test Algorithm You have an exported algorithm from BME AI-Studio that you want to test or demonstrate live with real specimens. For this mode you need a BSEC configuration file (
.config) and an AI configuration file (.aiconfig) and a on the SD card.
Record & Label Data
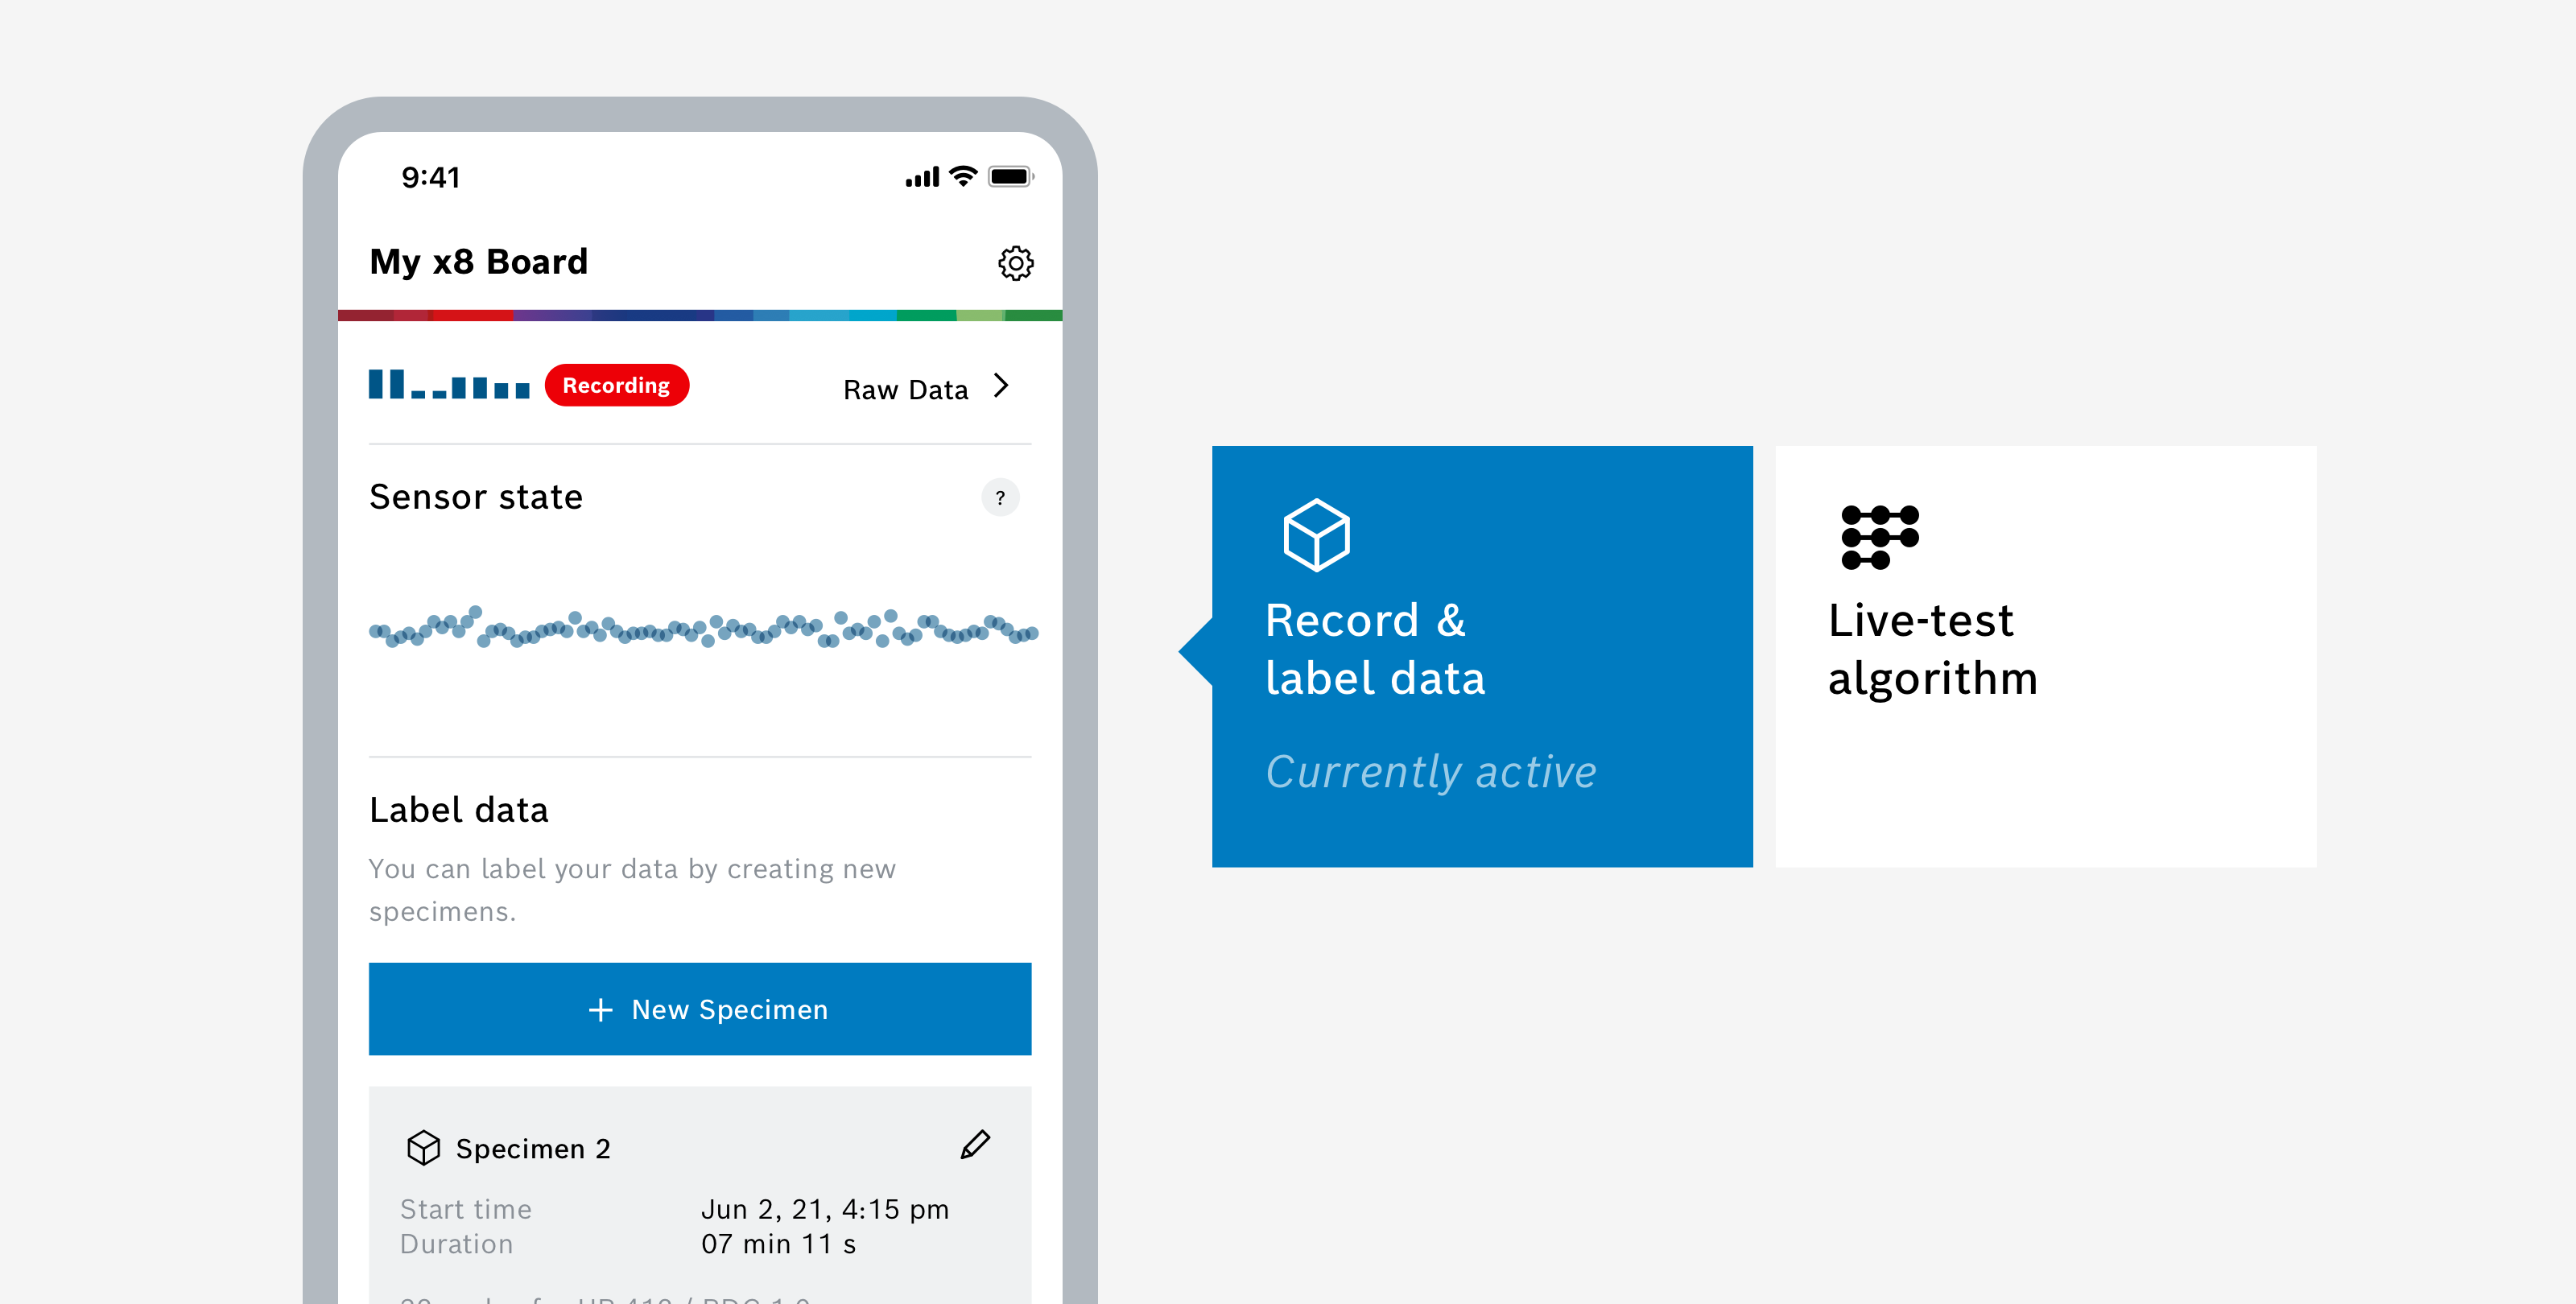
Use this mode if you want to record raw gas sensor data with the BME688 Development Kit and label your different specimens on the fly.
In this mode you can ...
- see the current sensor state
- label specimens on the fly
- see the recorded raw data
Please note
For this mode you need a board configuration file (.bmeconfig) on the SD card. Create these files using the BME AI-Studio desktop application, by selecting Configure BME Board and then Save to file. More info under I. Configure Board.
Sensor State
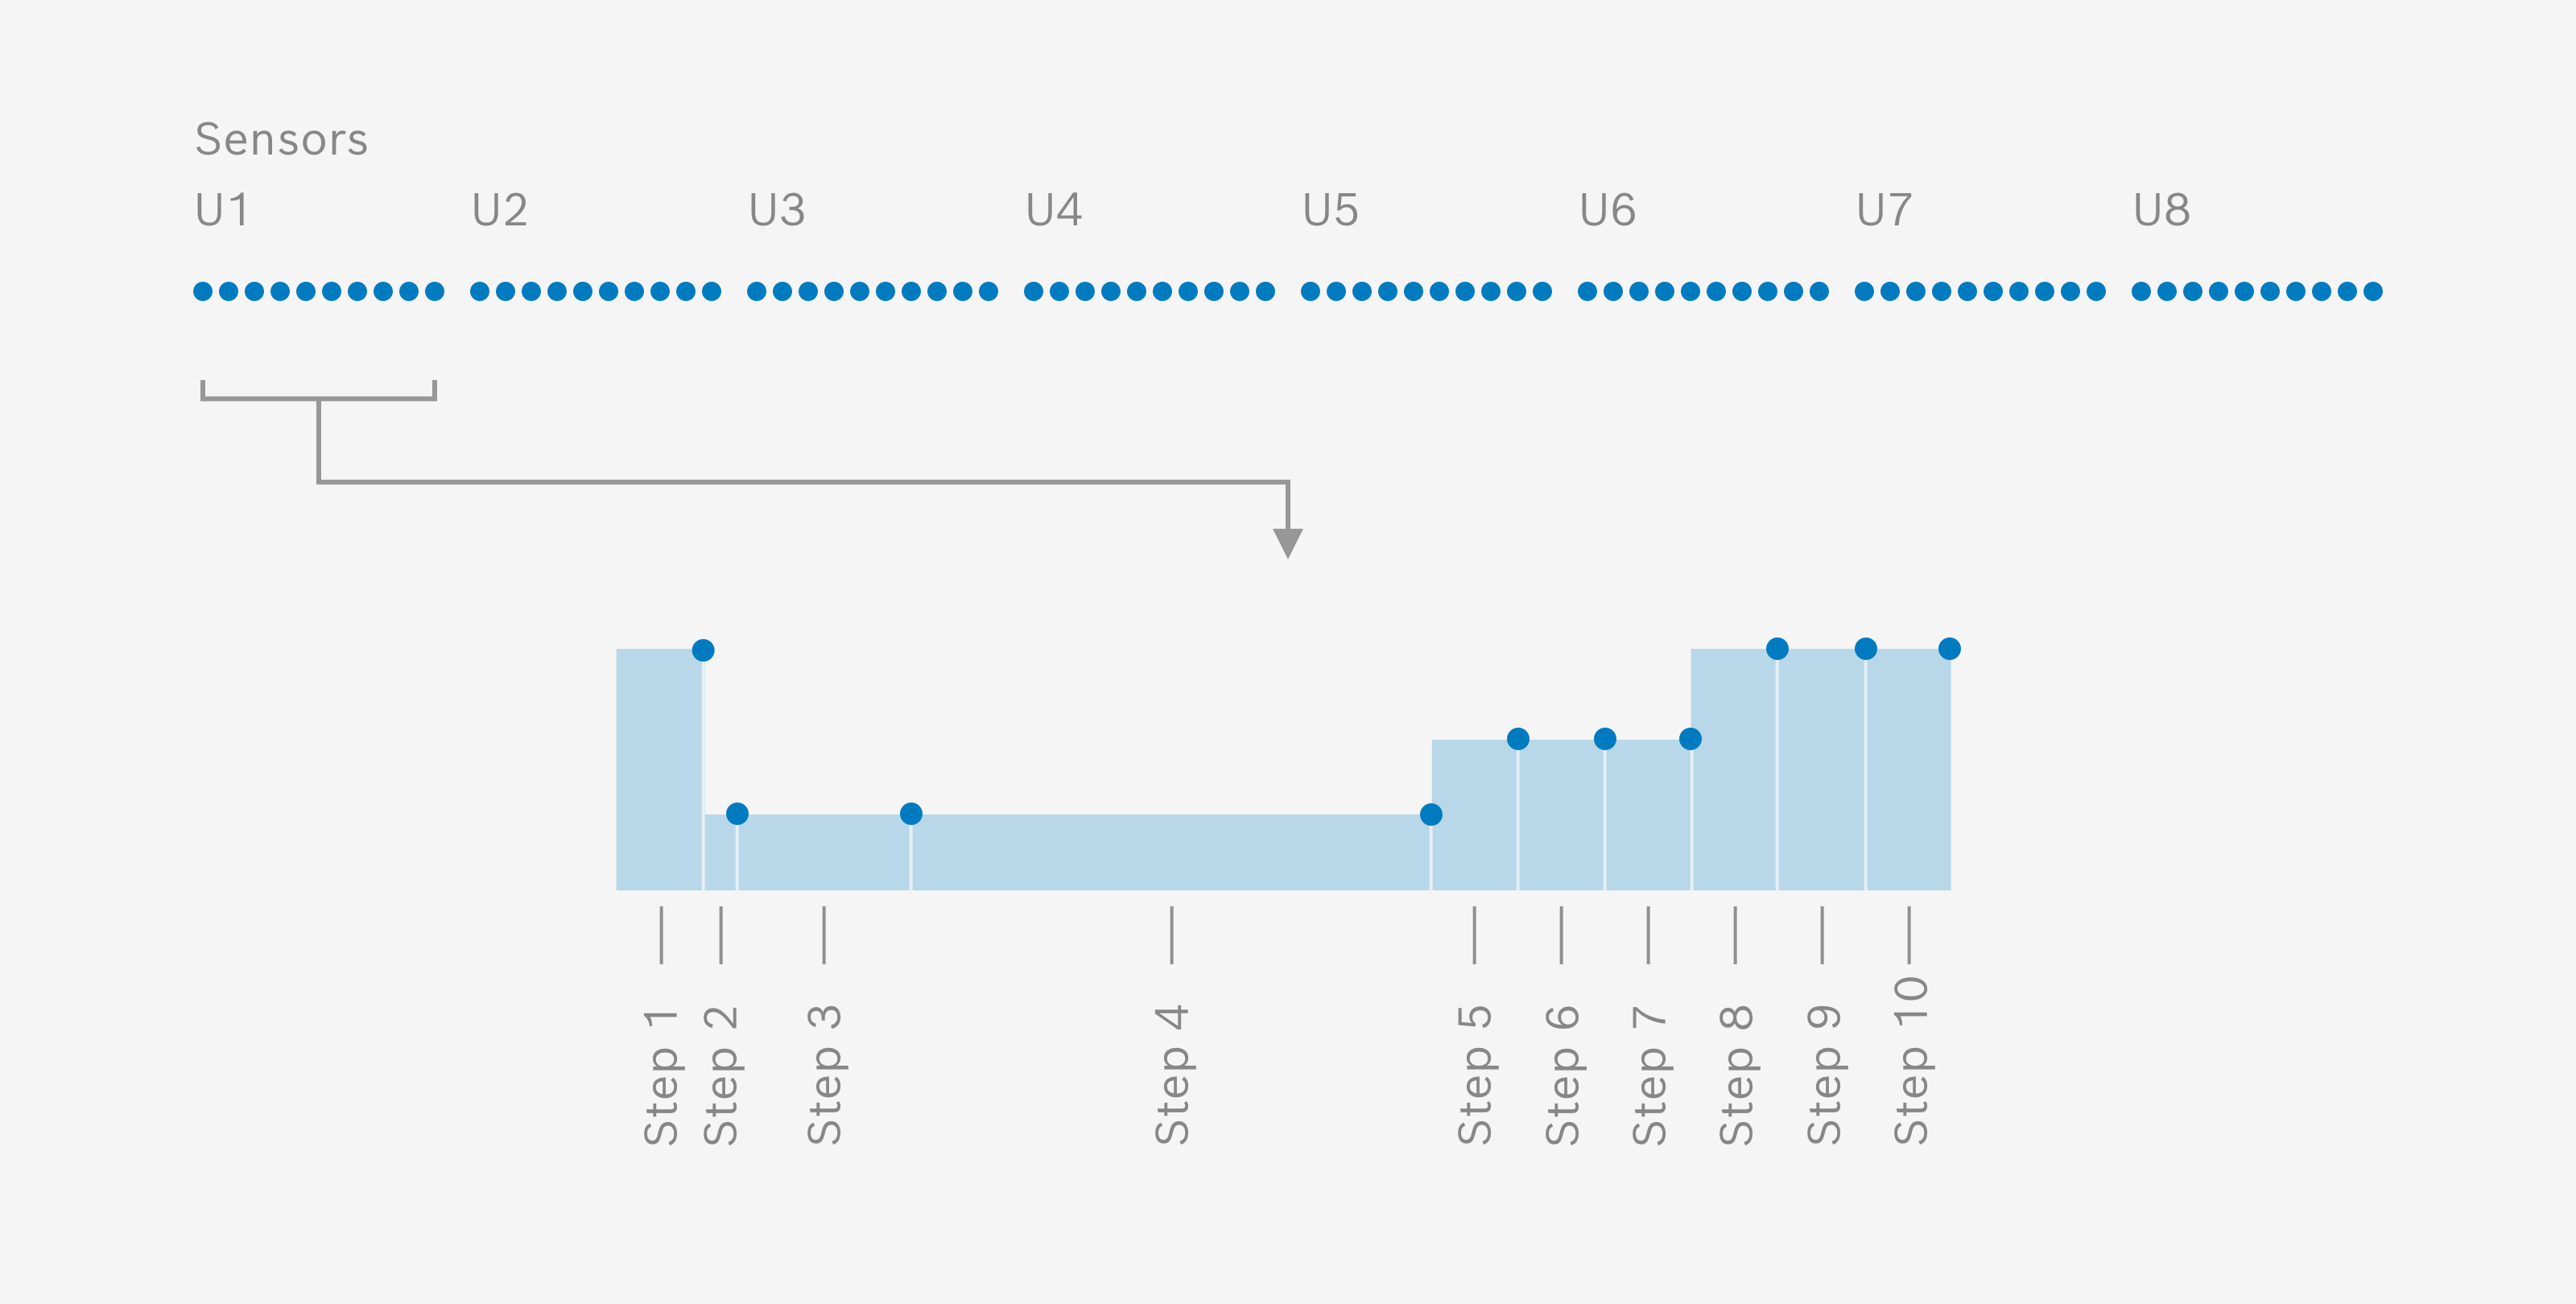
The sensor state graph visualises the stability (or variance) of recorded raw data. It shows 8 x 10 dots: each dot represents one of the ten steps in one of the eight heater profiles used for the eight sensors on the board.
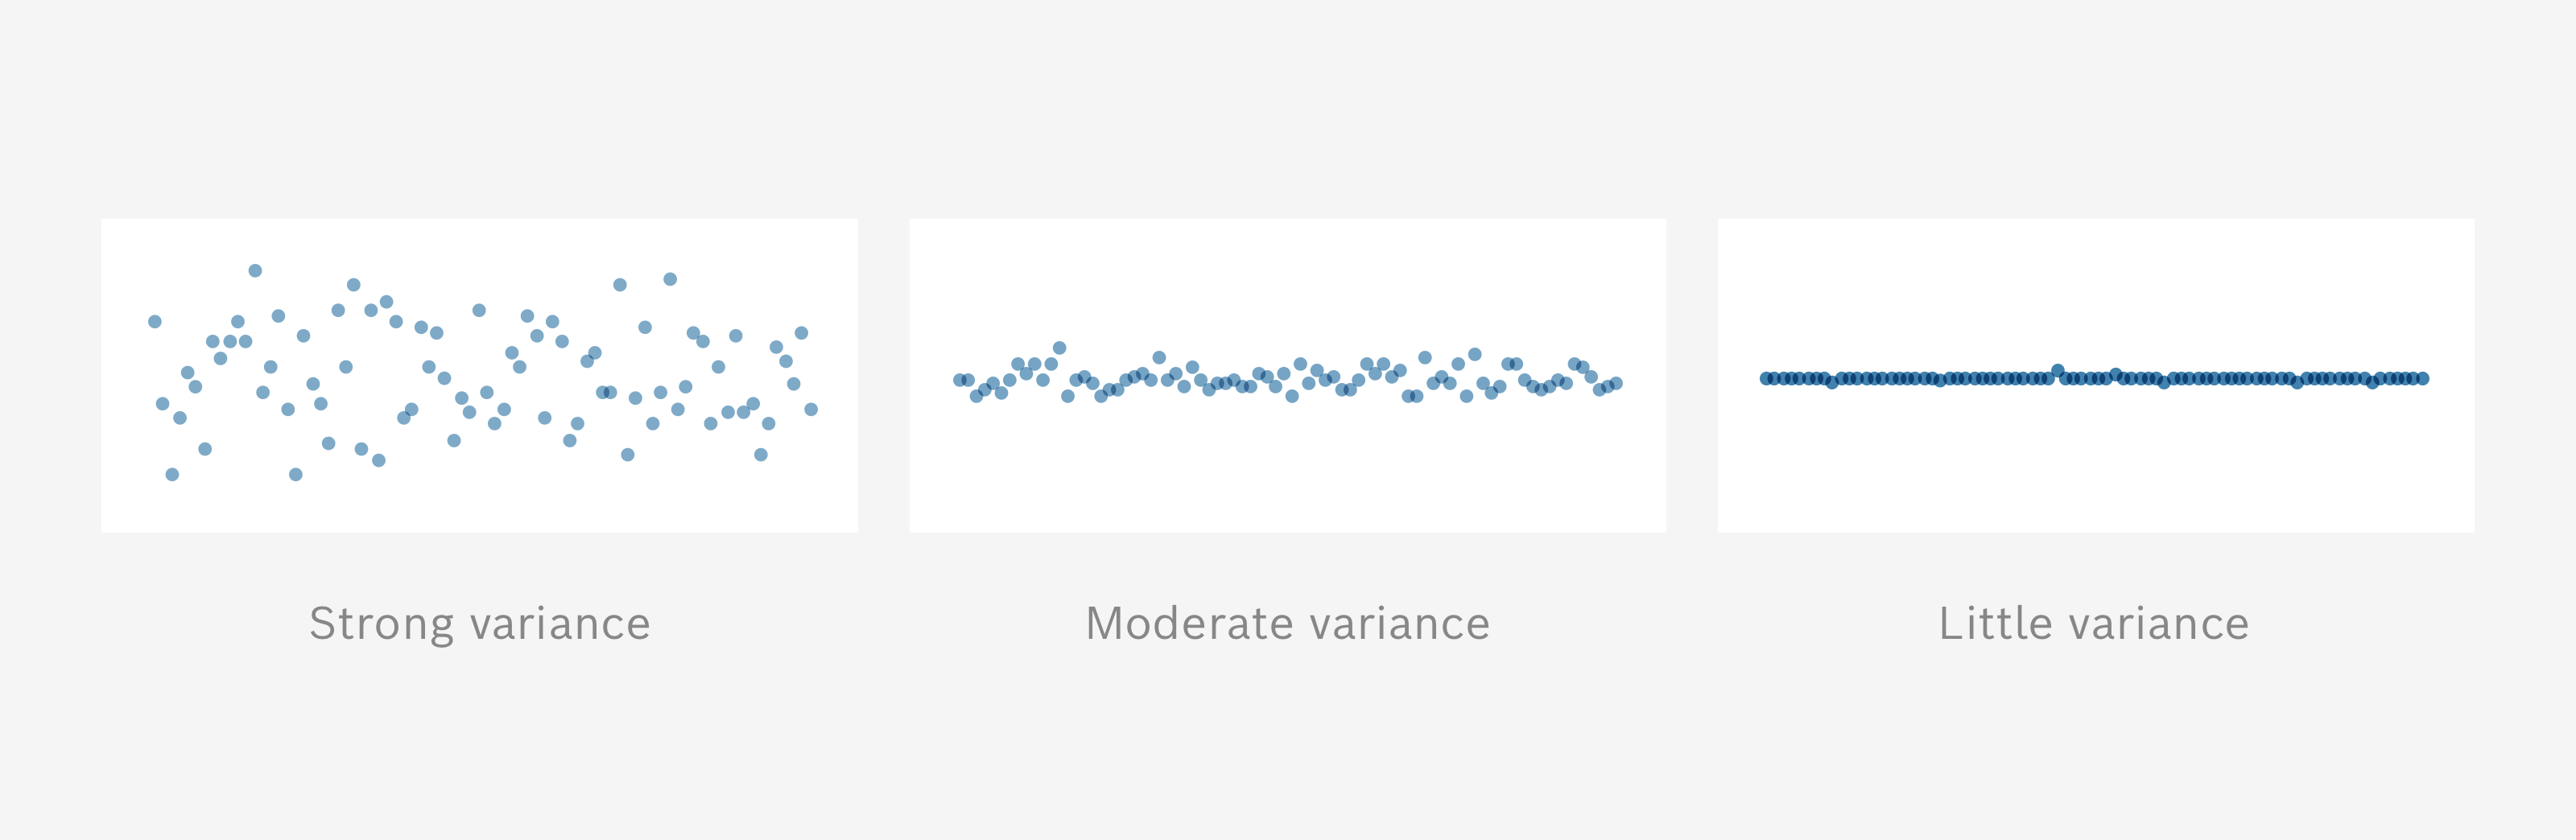
The vertical movement of each dots represents the stability (or variance) of the recorded signal of the respective sensor: The more movement, the more variance in the data; the less movement, the less variance in the data.
- A lot of movement: The data has strong variance and is not yet stable. Wait and keep the recording running.
- Moderate movement: The data has moderate variance and is not yet stable. Wait a bit longer and keep the recording running.
- Little movement: The data has almost no variance and is stable. This is the preferred state. Keep recording!
Good to know
Try to record data for each specimen with as little variance as possible.
Please note
If you use a board configuration with a Duty Cycle that includes Sleeping Cycles, the sensors might not reach a stable state before the next Sleeping Cycle starts.
Label specimens on the fly
While the BME688 Development Kit is recording, you can use the app to label your specimens on the fly. Simply select New Specimen for each new specimen and enter a respective label and comment. For more info and best practices about labeling your specimens, please take a look at II. Record Data.
The labels and comments for each specimen are saved in a separate file (.bmelabelinfo) on the SD card. During the import of raw data into your Specimen Collection of your project, BME AI-Studio will automatically look for a .bmelabelinfo file and add the respective labels and comments to your specimens.
Below the New Specimen button you will find a list of all your defined specimens, with start time, duration and number of recorded cycles. Select the Pen button to edit label and comment for a specimen.
Raw Data
Select Raw Data on the top right to access the recorded raw data. The app shows you for each gas sensor on the BME688 Development Kit:
- the used HP/RDC combination (Heater Profile and Duty Cycle), with current step indicator
- the recorded raw data (gas resistance data)
- the recorded environmental data (Temperature, humidity, pressure)
Select a different sensor using the dropdown on the top of the screen.
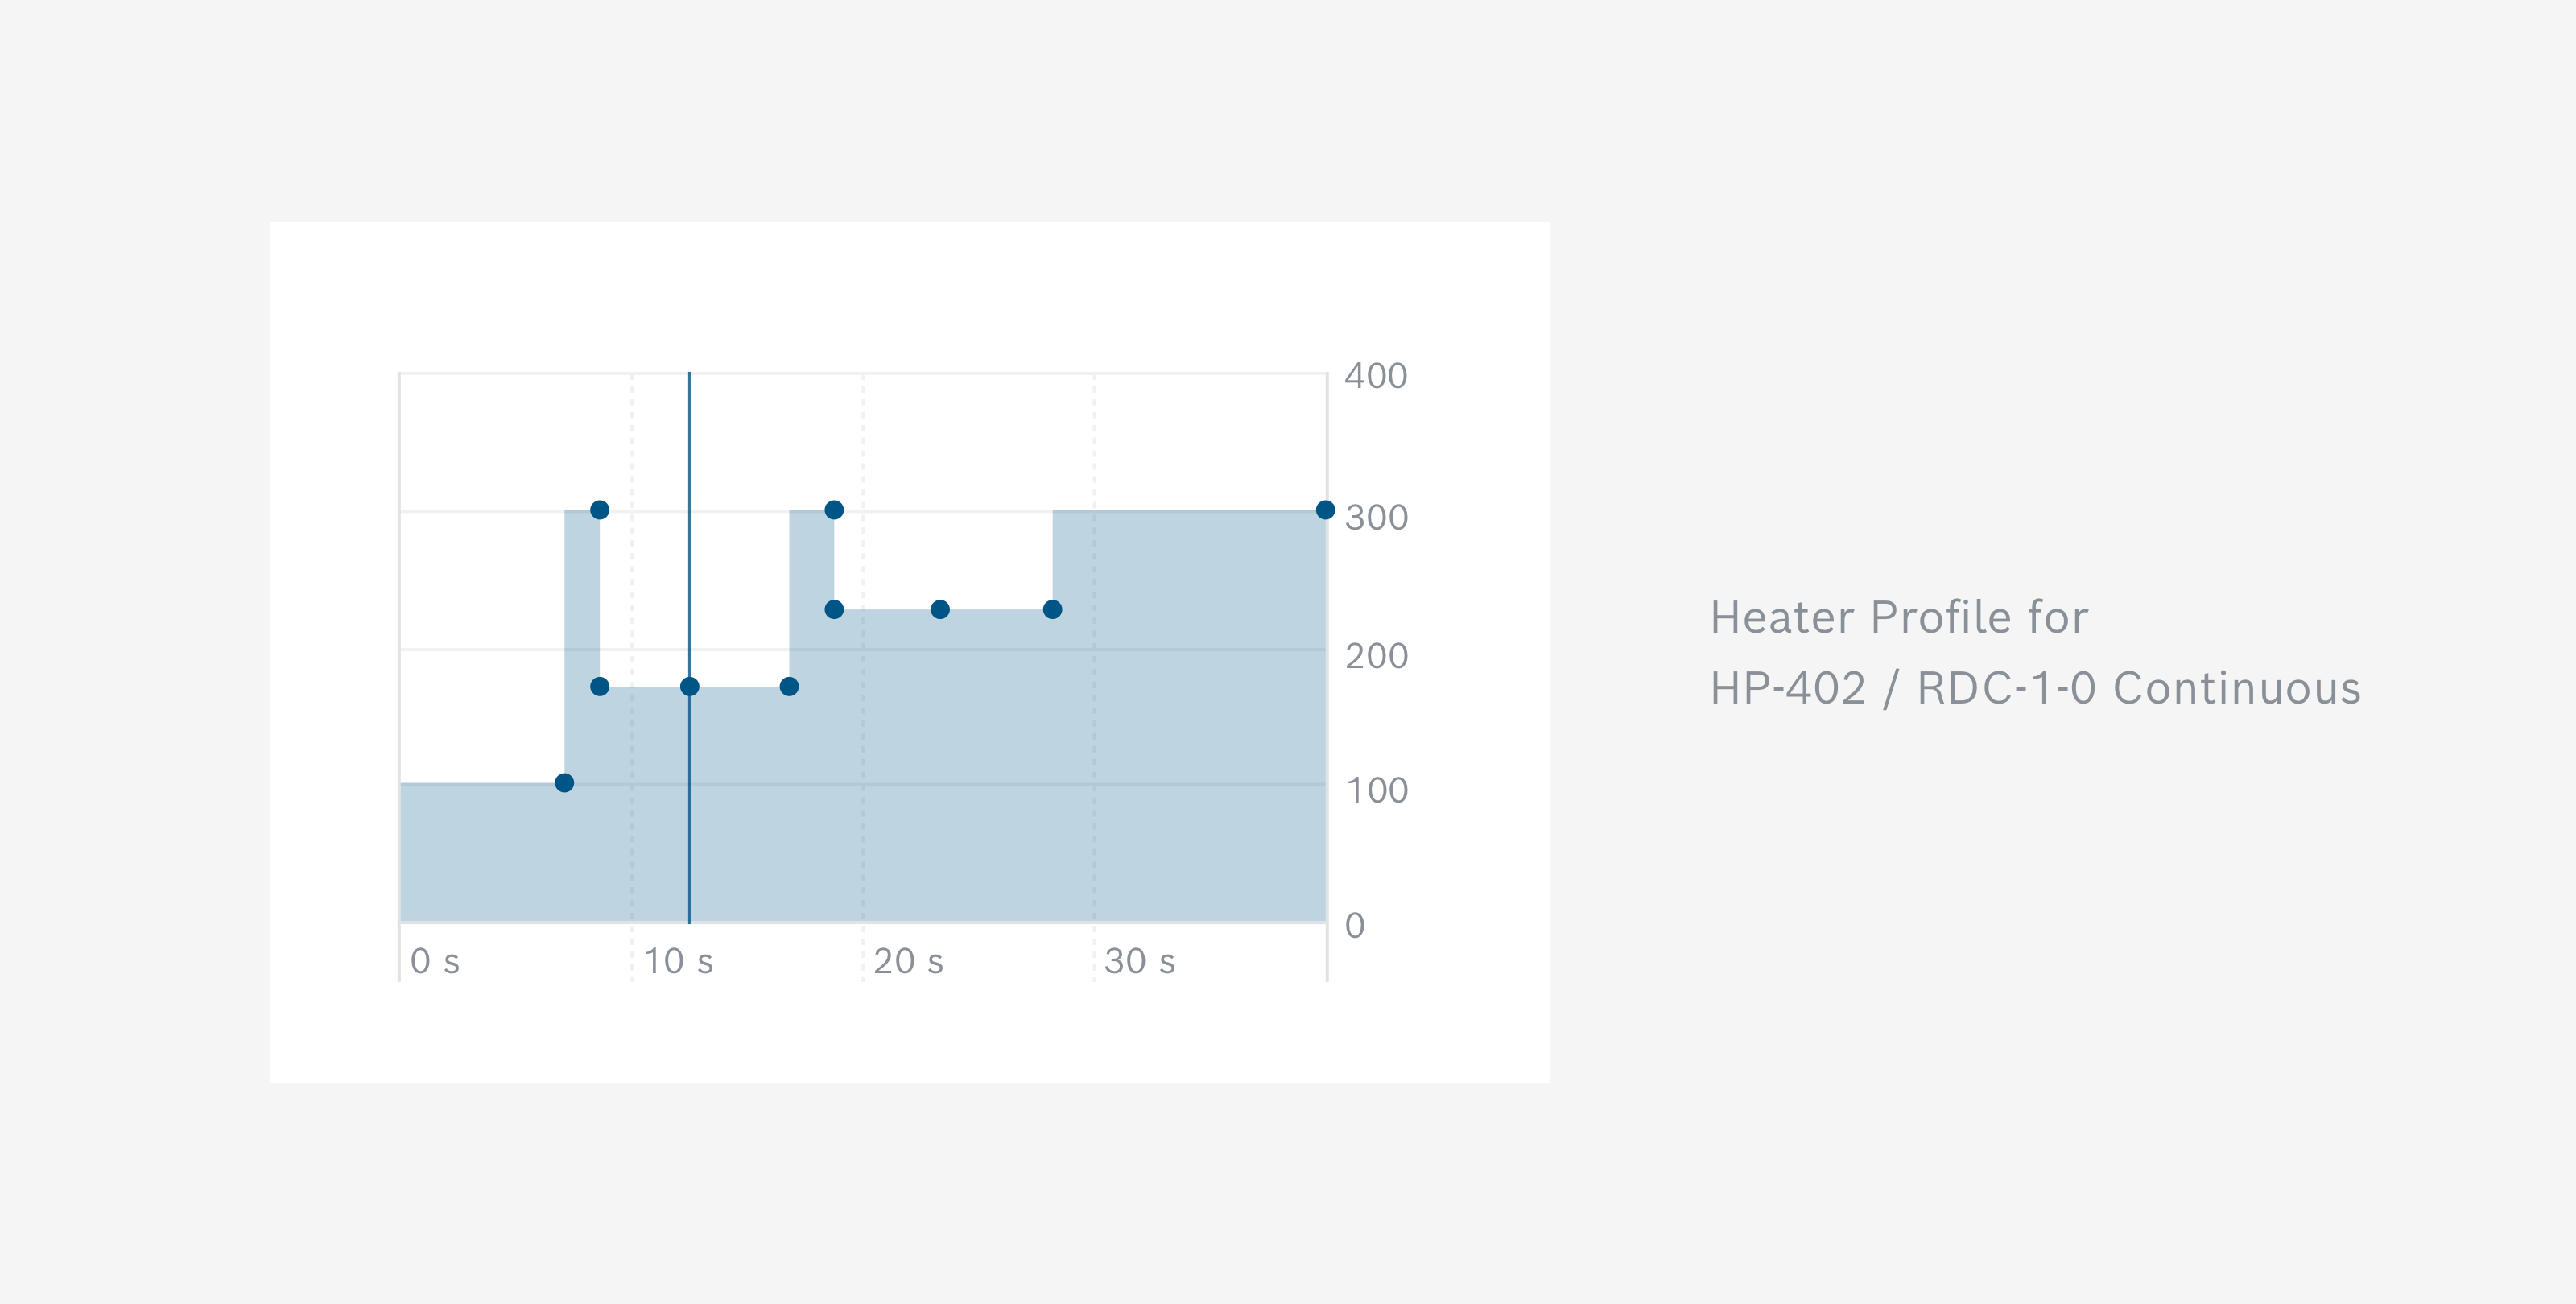
The Heater Profile Graph shows the steps of the used Heater Profile and indicates the current step. If the sensor is sleeping, the graph is greyed out. For further information, please see Glossary.
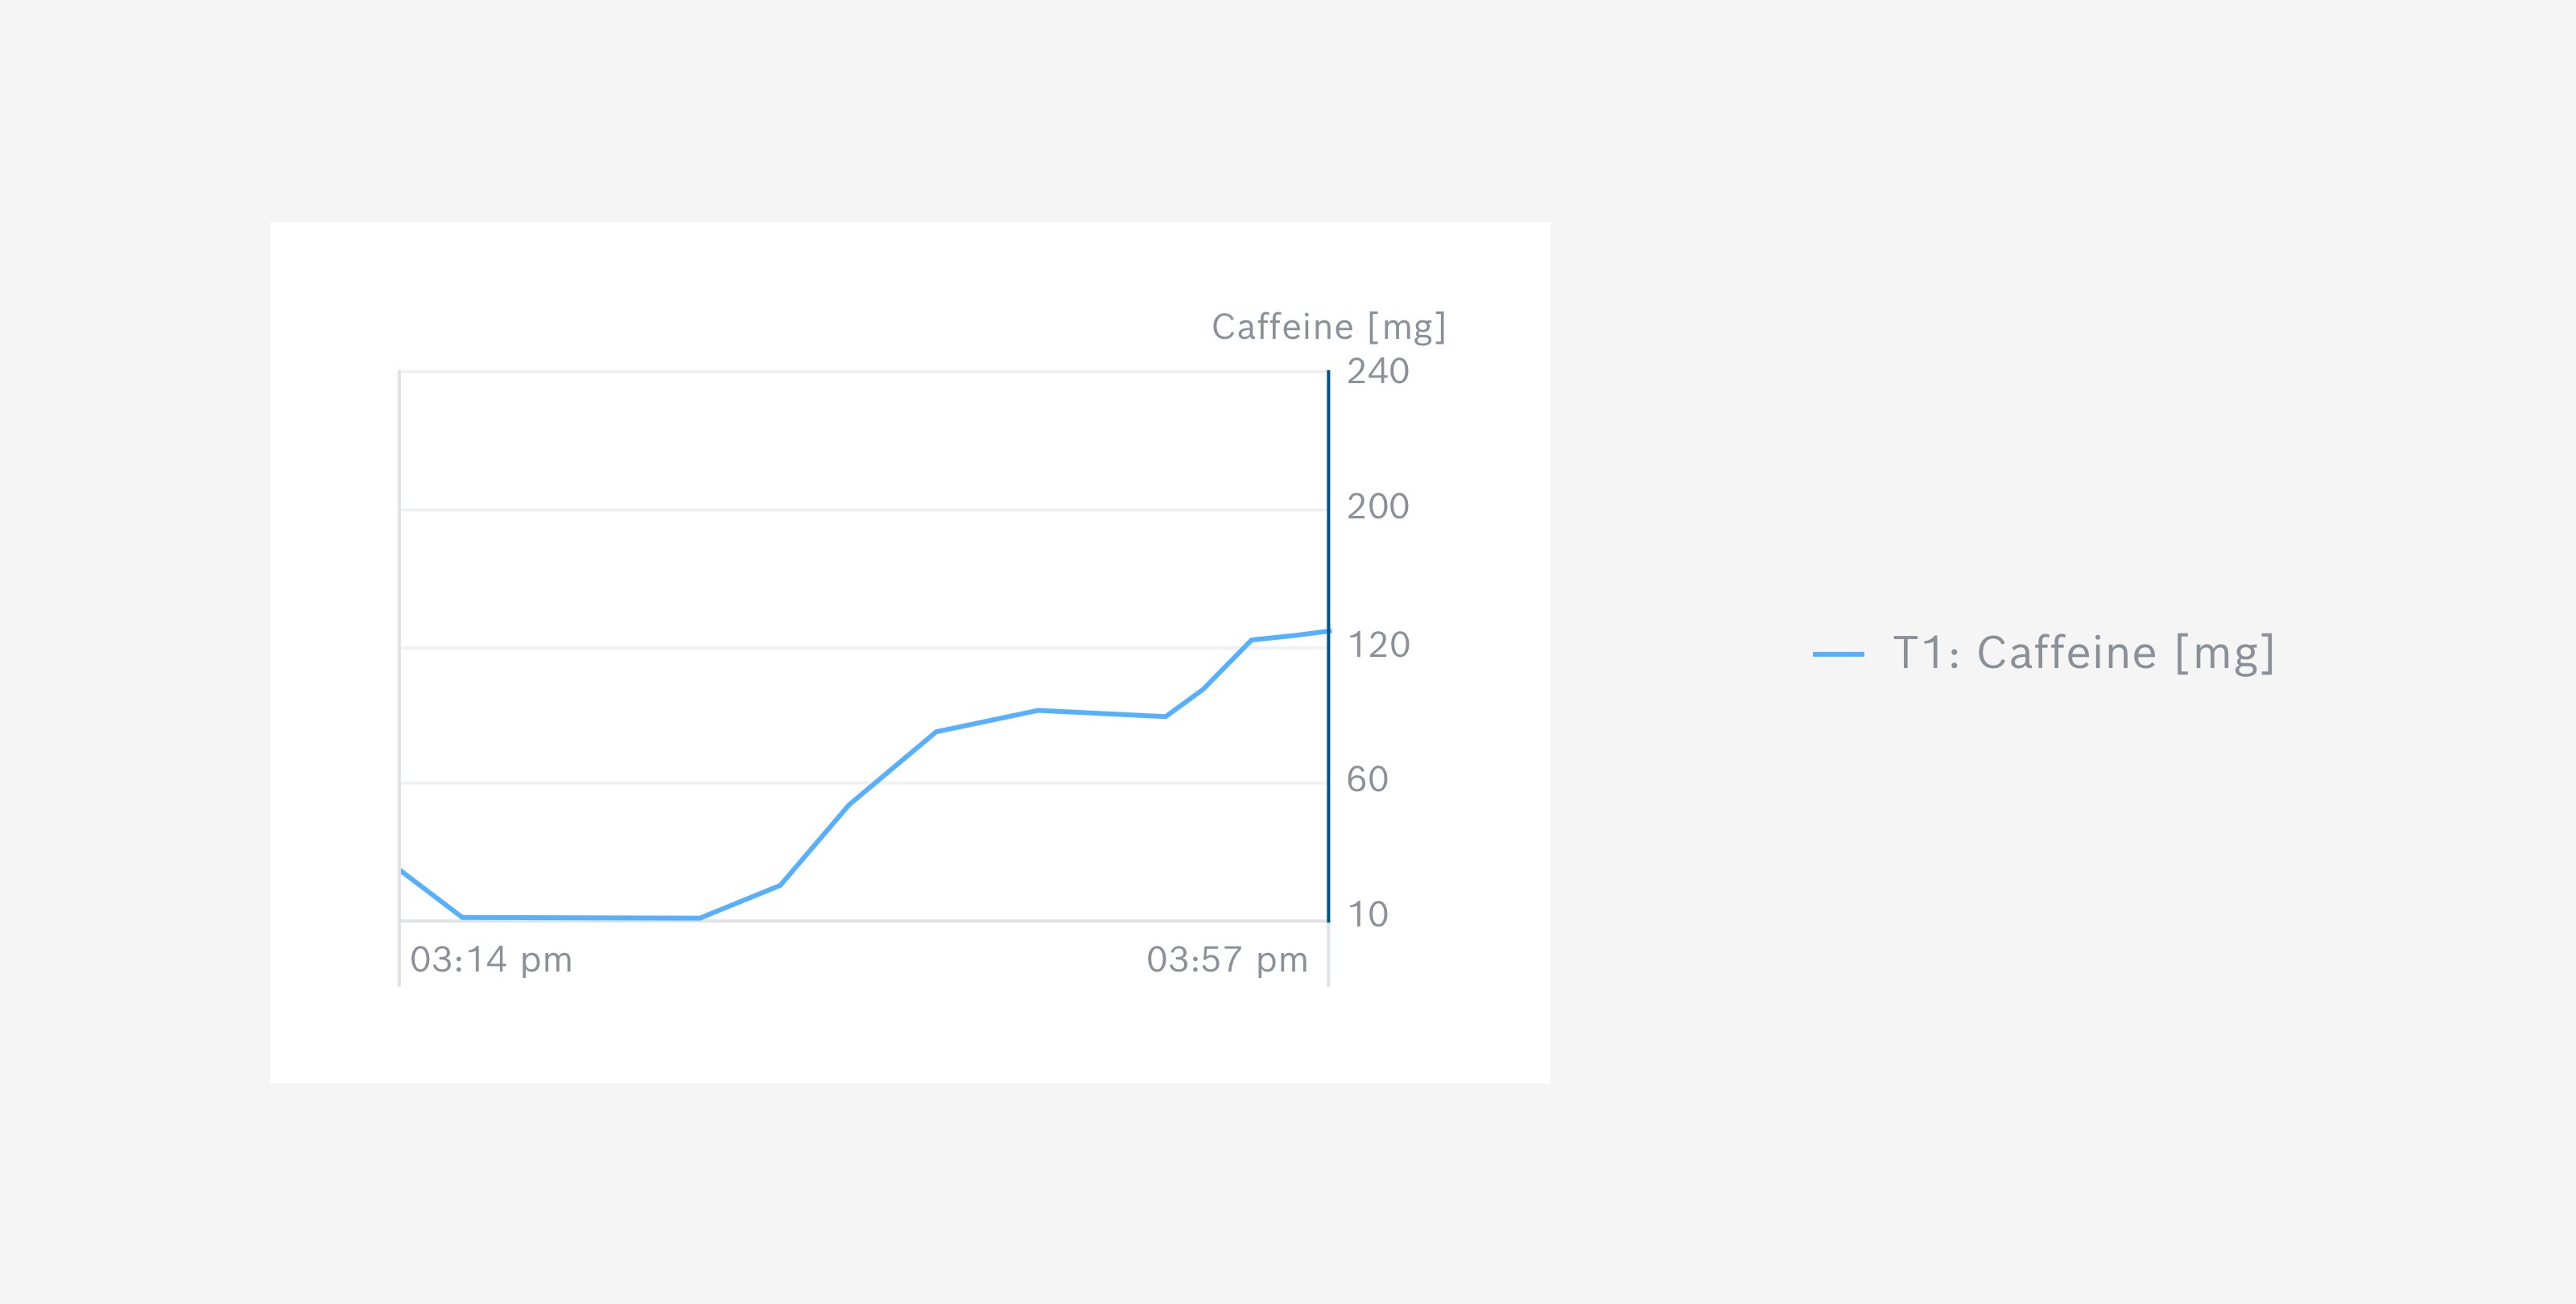
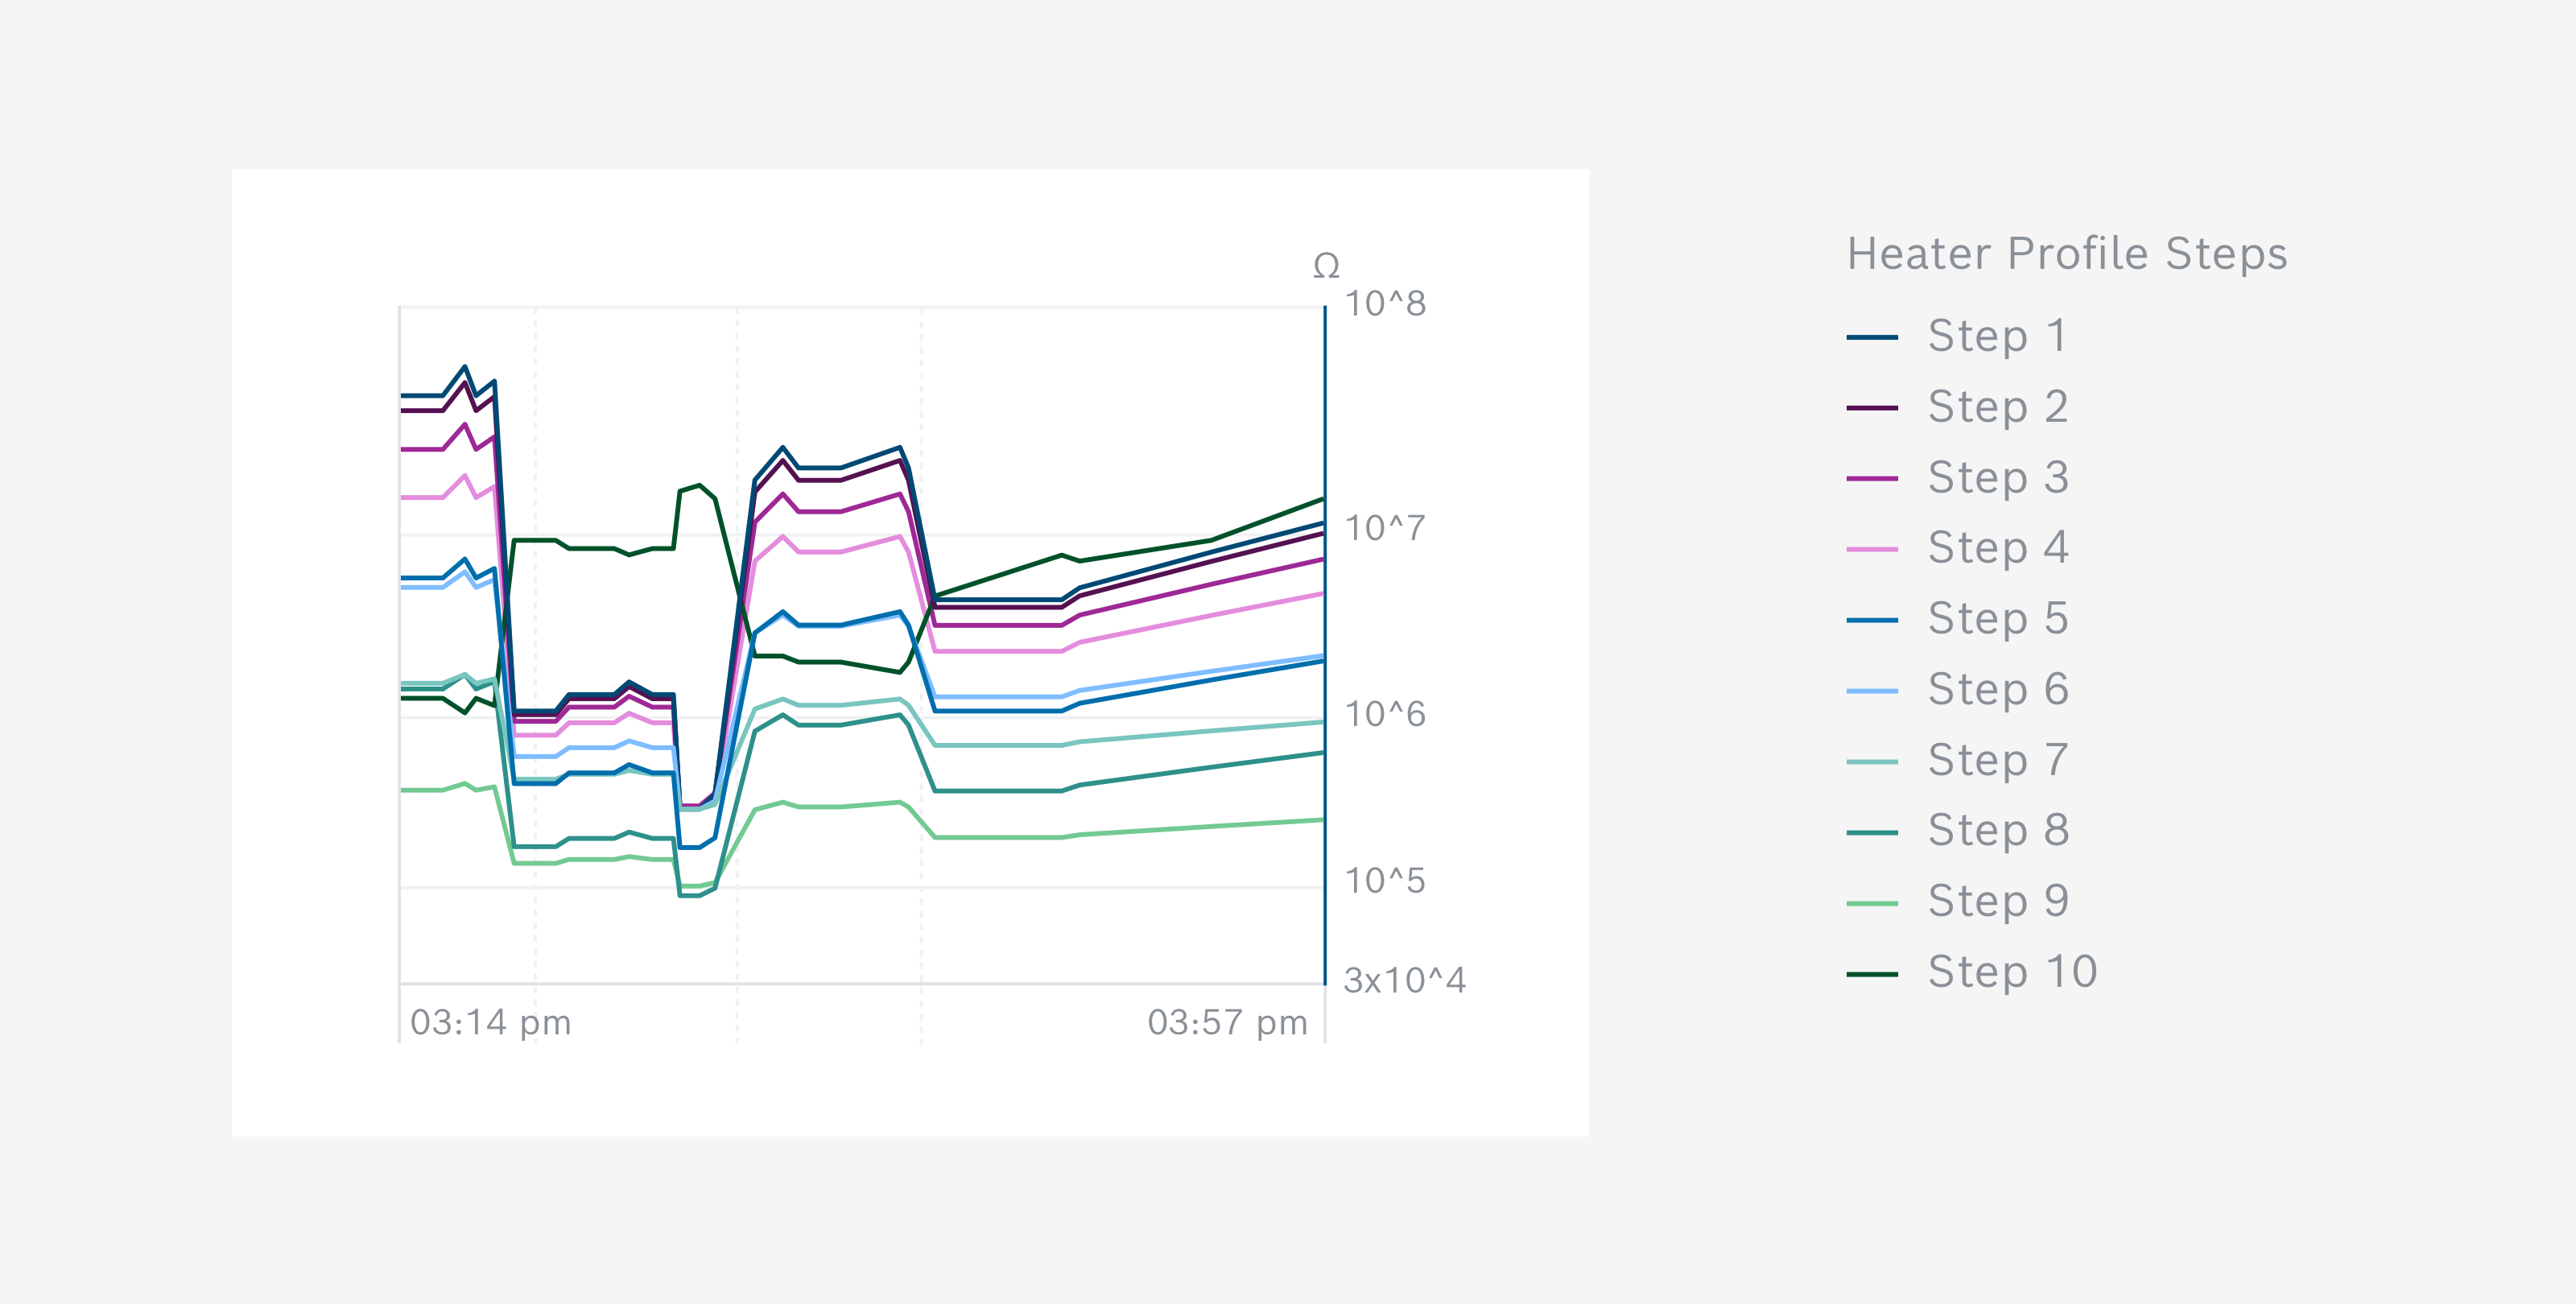
The Gas Resistance Data Graph shows the raw gas resistance data measured by the sensor for every Heater Profile step on a timeline. This means each line follows the time evolution of a measuring point of the Heater Profile. For further information, please see Import Data.
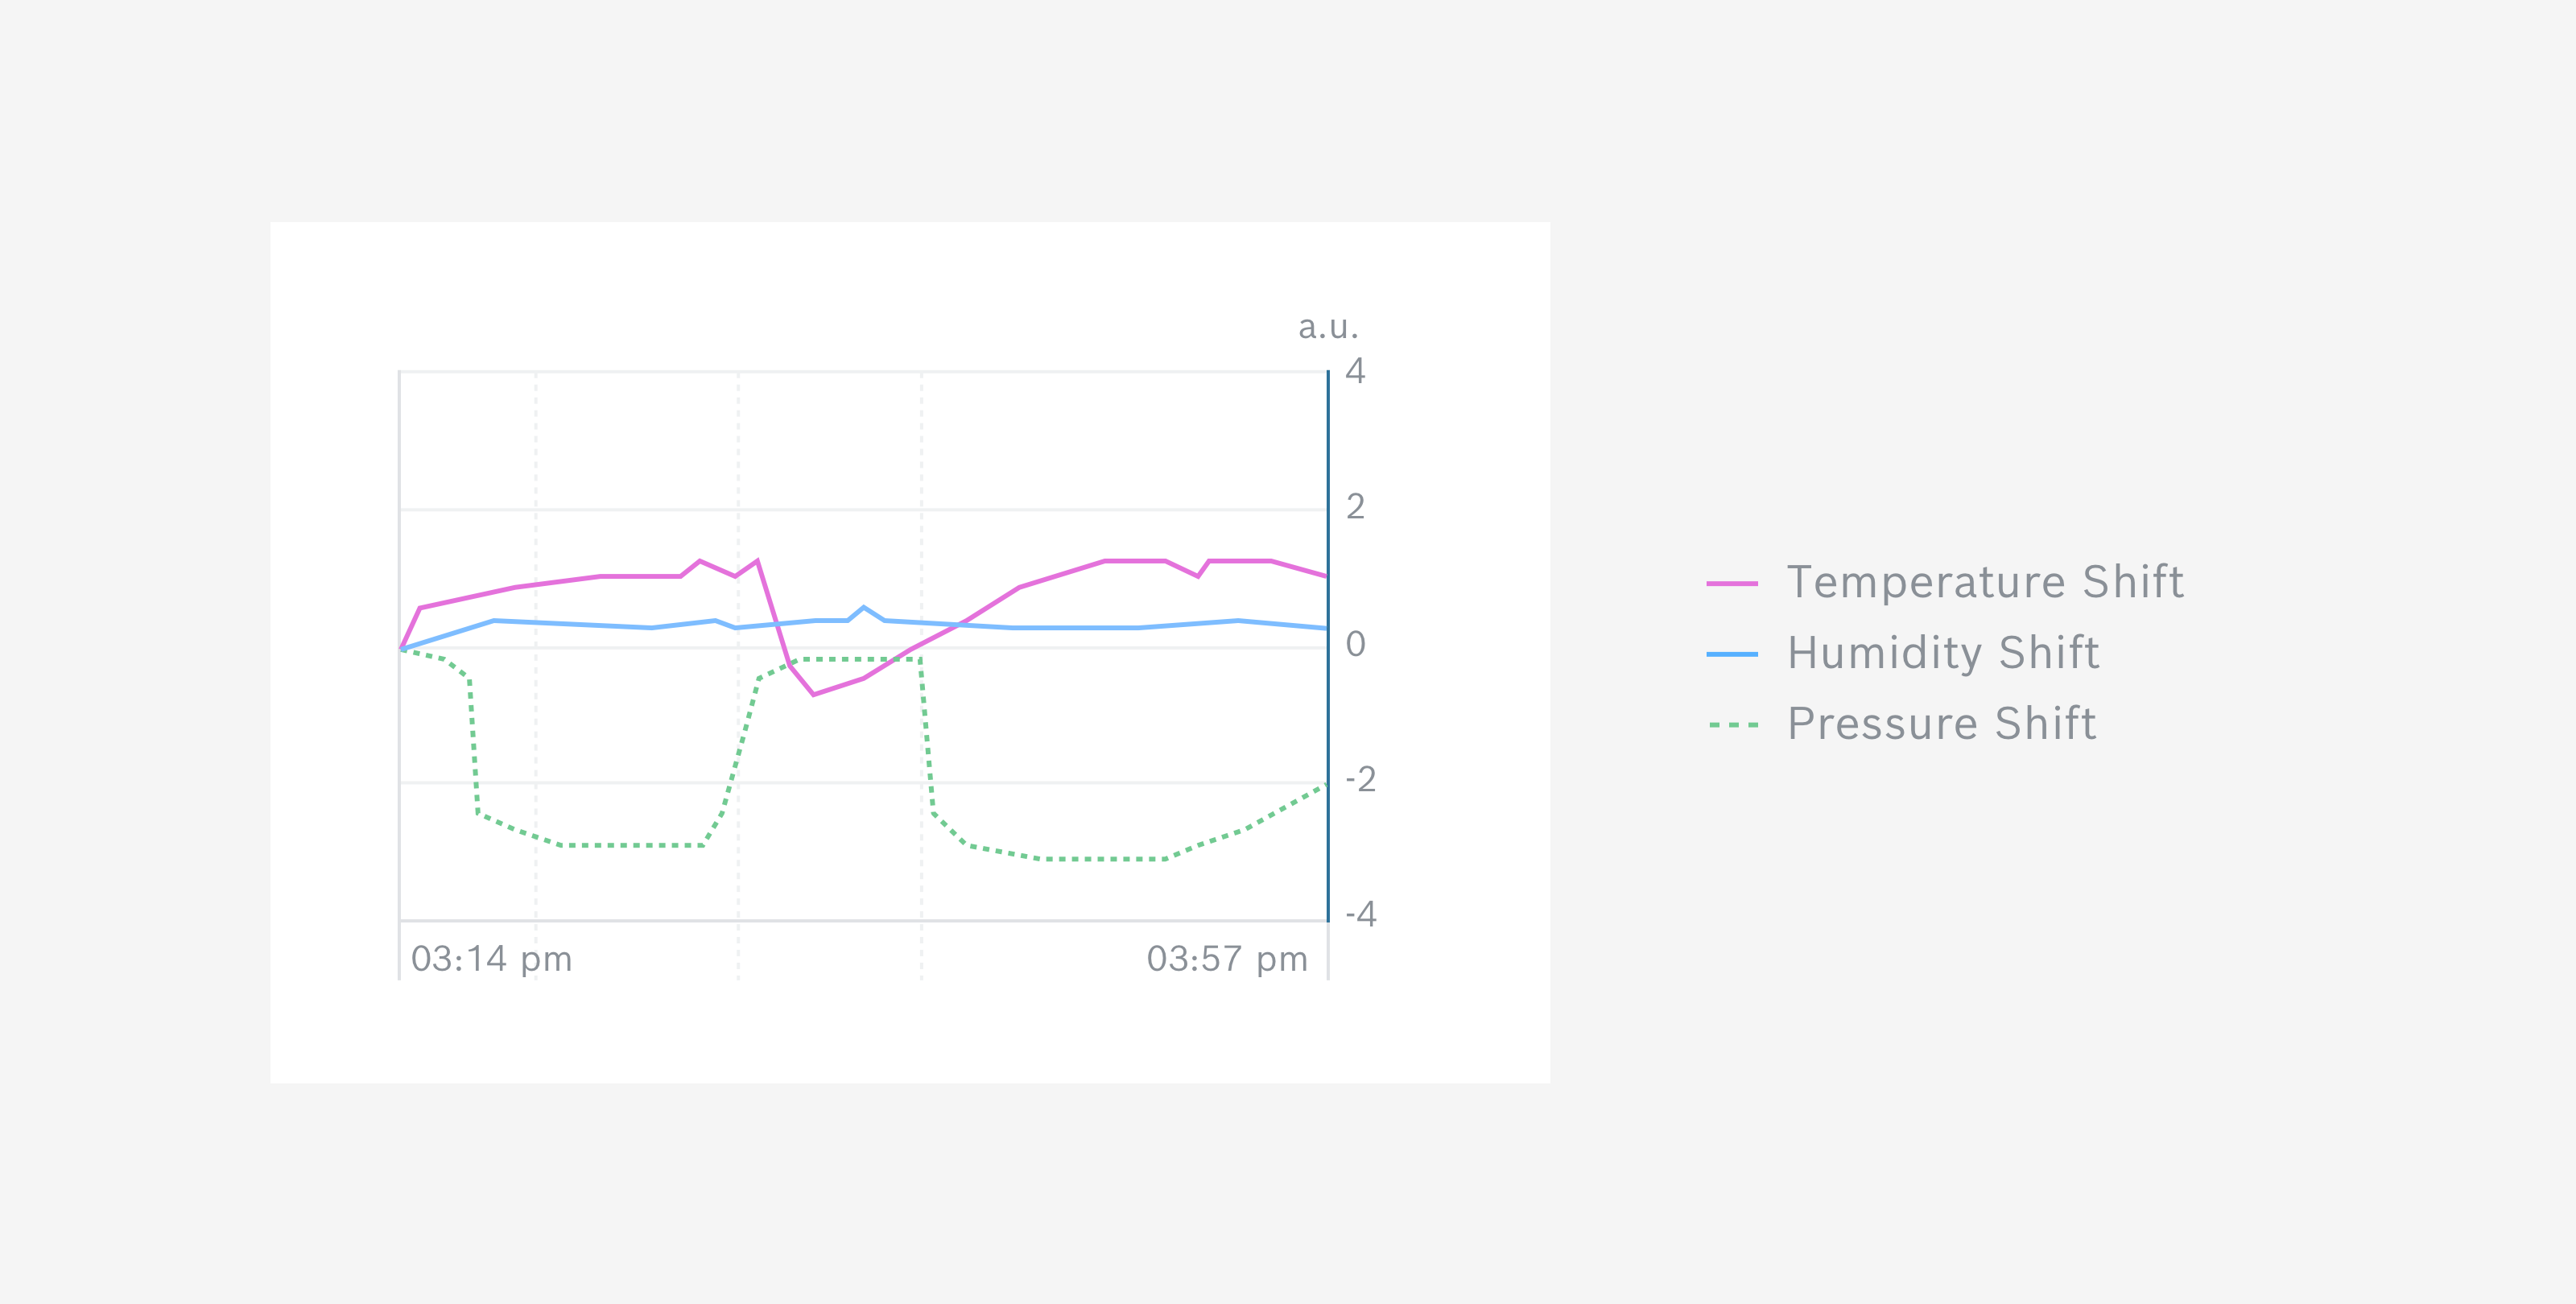
The Environmental Data Graph shows the relative changes of temperature, humidity and pressure measured by the sensor. This means the curves don't show absolute values, but instead how the values changed compared to the beginning of the measurement. This is why all curves start at zero.
Live-Test Algorithm
Use this mode if you have an exported classification or regression algorithm from BME AI-Studio that you want to test or demonstrate live with real specimens.
In this mode you can ...
- see the current prediction of each sensor (currently only four sensors at a time)
- set a class as current "Ground Truth" (for Classification Algorithms)
- open a fullscreen demo view
Please note
For this mode you need a BSEC configuration file (.config) and an AI configuration file (.aiconfig) on the SD card. Create these files using the BME AI-Studio desktop application, by selecting Export as BSEC Config File within your algorithm training results. More info under VI. Evaluate Algorithms.
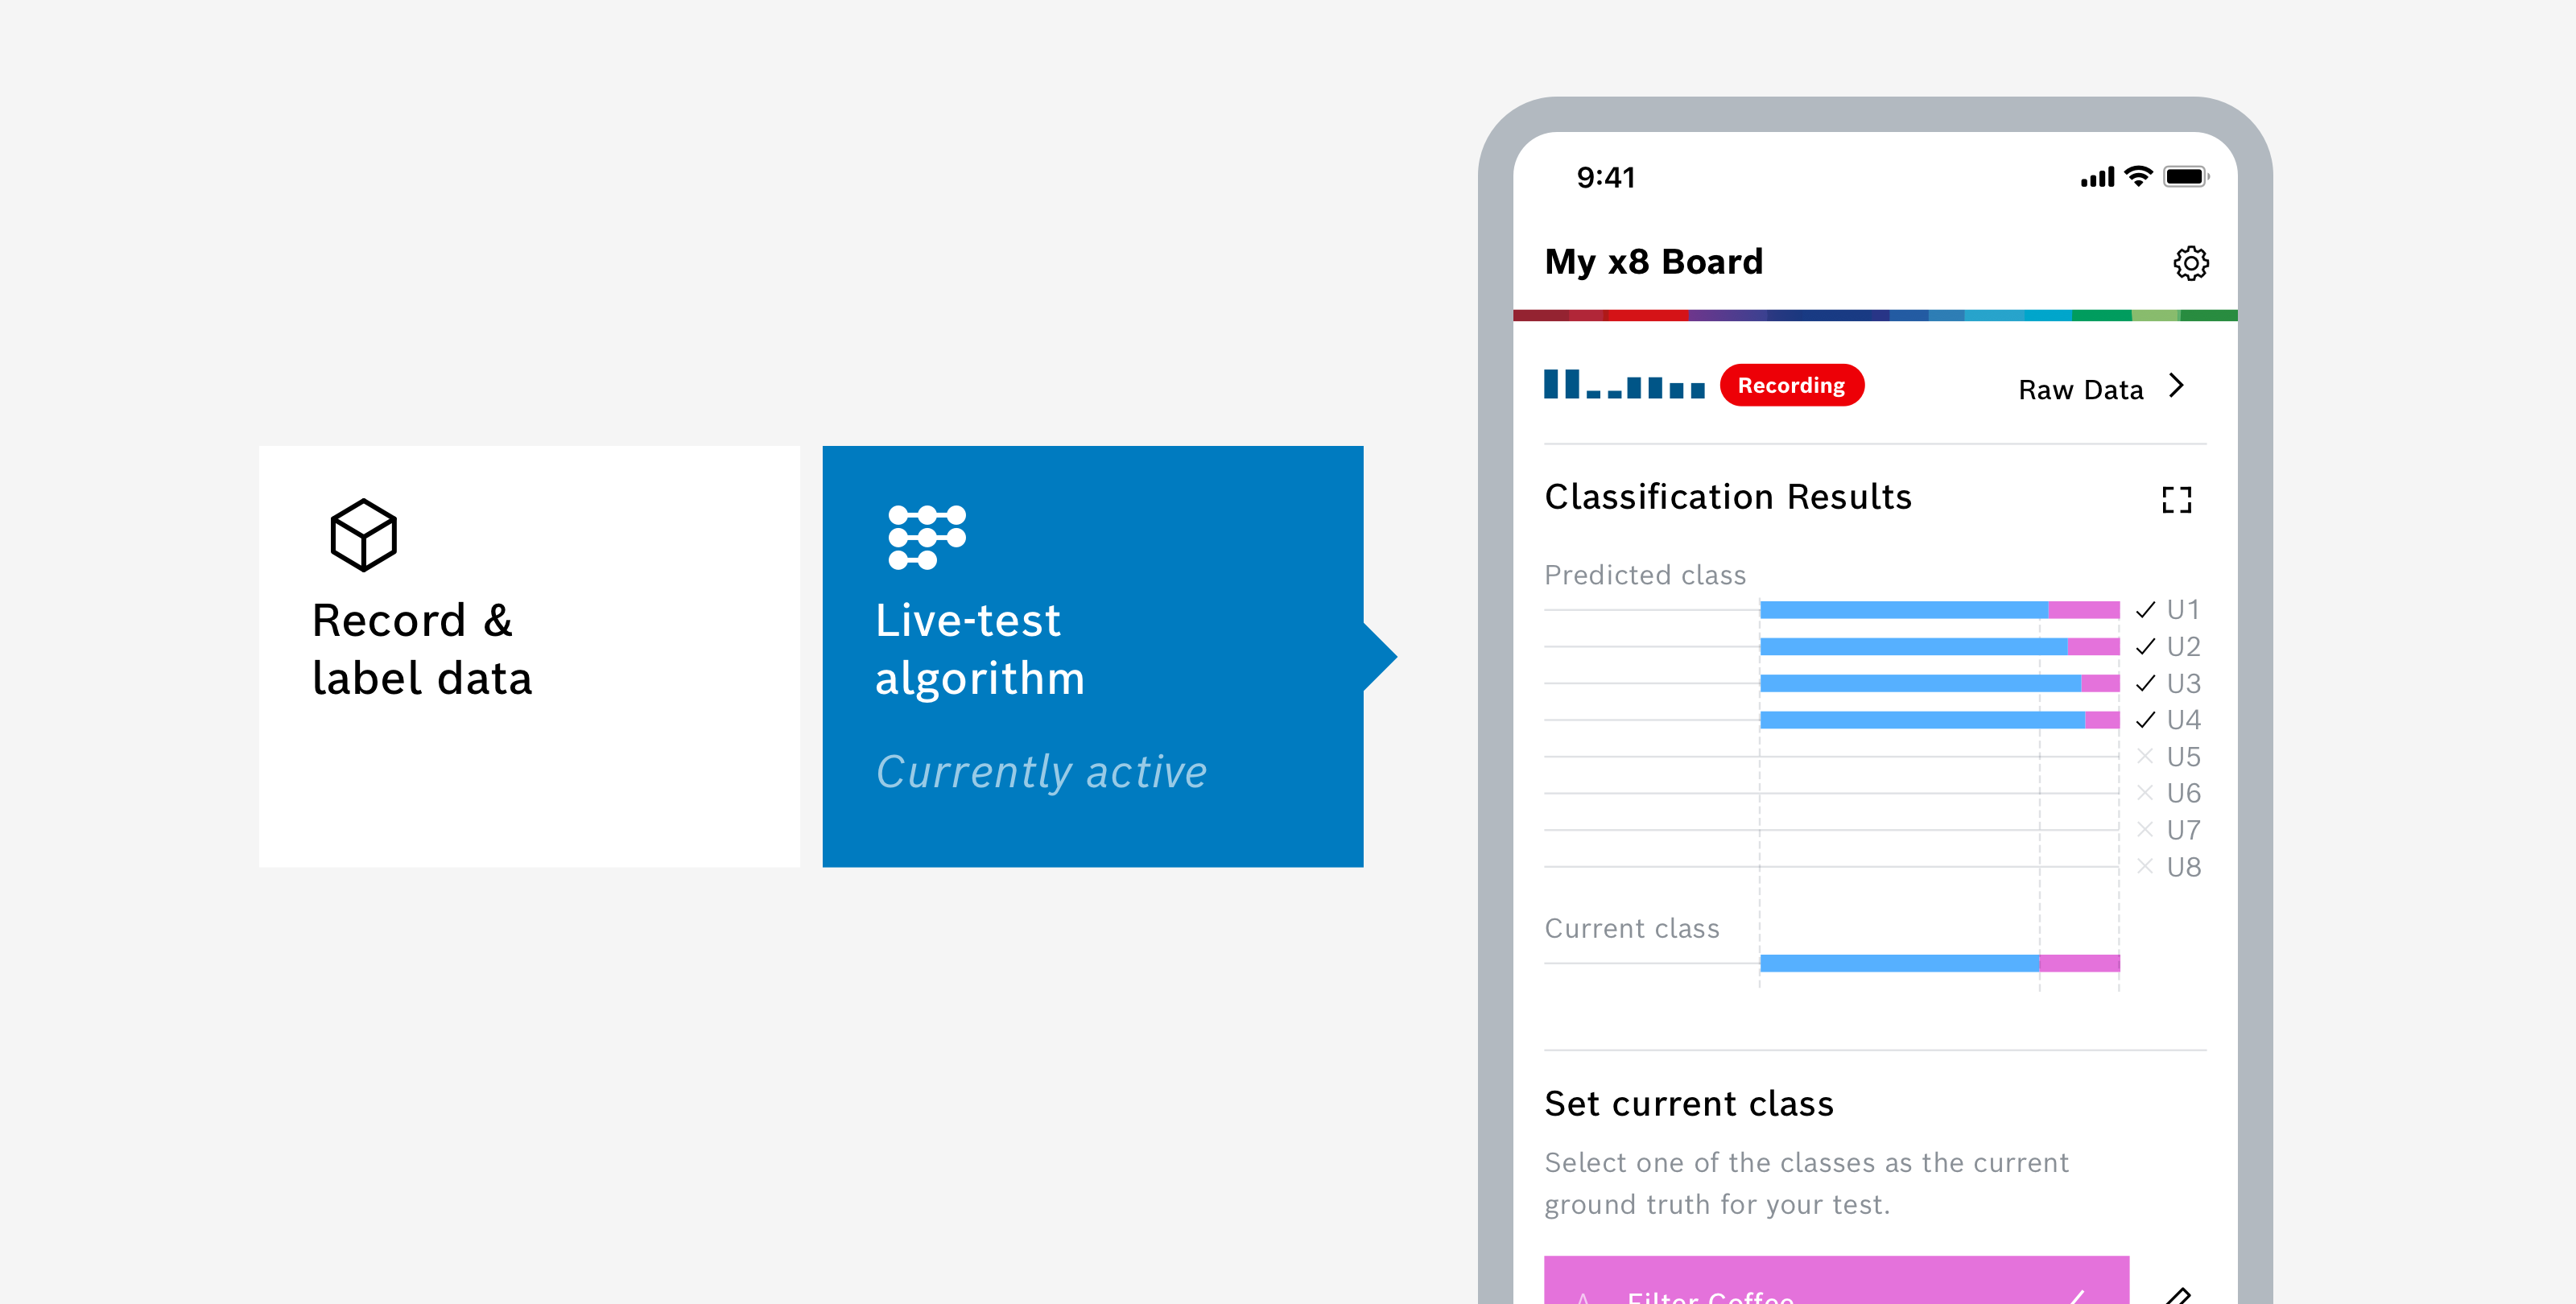
Predictions
If there is a classification algorithm on your SD card, in this mode each sensor of the board will run your algorithm and make a class prediction. You can now test your algorithm with different specimens: Let the sensors record your specimen for a while (same as during recording) and see if the sensors made the correct prediction.
The graph will show you in a timeline which class each sensor predicts. As time passes, the timeline moves automatically from right to left. If a sensor did not yet make a prediction, there will by little x symbol. This is often the case, when the live-testing has just begun and there is not yet enough data available to make a prediciton.
If there is a regression algorithm on your SD card, in this mode each sensor of the board will run your algorithm and make a value prediction for each regression target. You can now test your algorithm with different specimens: Let the sensors record your specimen for a while (same as during recording) and see if the sensors made the correct prediction.
The graph will show you in a timeline which value each sensor predicts for the selected target. As time passes, the timeline moves automatically from right to left. Below the graph you can see the actual values that are predicted by each sensor for the selected target.
If your regression algorithm is trained to predict multiple targets, you can use the dropdown at the top of the screen to select for which target the predictions should be displayed.
Please note
As of now, the algorithm can not run on all eight sensors simultaneously. Only four sensors can run the algorithm at a time.
Set Current Class as Ground Truth
The lowest line of the graph for classification predictions shows the "Ground Truth" – the class that is the actual class of your specimen. Or in other words: The class that the sensors should ideally be predicting.
To set the a class as the current ground truth for your test, simply select one of the classes from the list. The graph will show the currently selected ground truth accorindingly.
Demo View
The app also offers a special demo view which shows the predictions in a more reduced and striking way. Simply select the Fullscreen button on the top right.
For classification algorithms the currently predicted class is displayed. You can switch between the predictions of each sensor by swiping left and right.
For regression algorithms the currently predicted target value is displayed. You can switch between the predictions for this target of each sensor by swiping left and right. To switch between the predictions for the the different targets swipe up and down.
Use this screen for presentations and demonstration situations.
Raw Data
Select Raw Data on the top right to access the recorded raw data. You can switch between different sensors using the dropdown on the top of the screen.
For classification algorithms the app shows you for each gas sensor on the BME688 Development Kit:
- the used HP/RDC combination (Heater Profile and Duty Cycle), with current step indicator
- the currently predicted class
- the prediction likeliness for each class on a timeline
- the recorded raw data (gas resistance data)
- the recorded environmental data (Temperature, humidity, pressure)
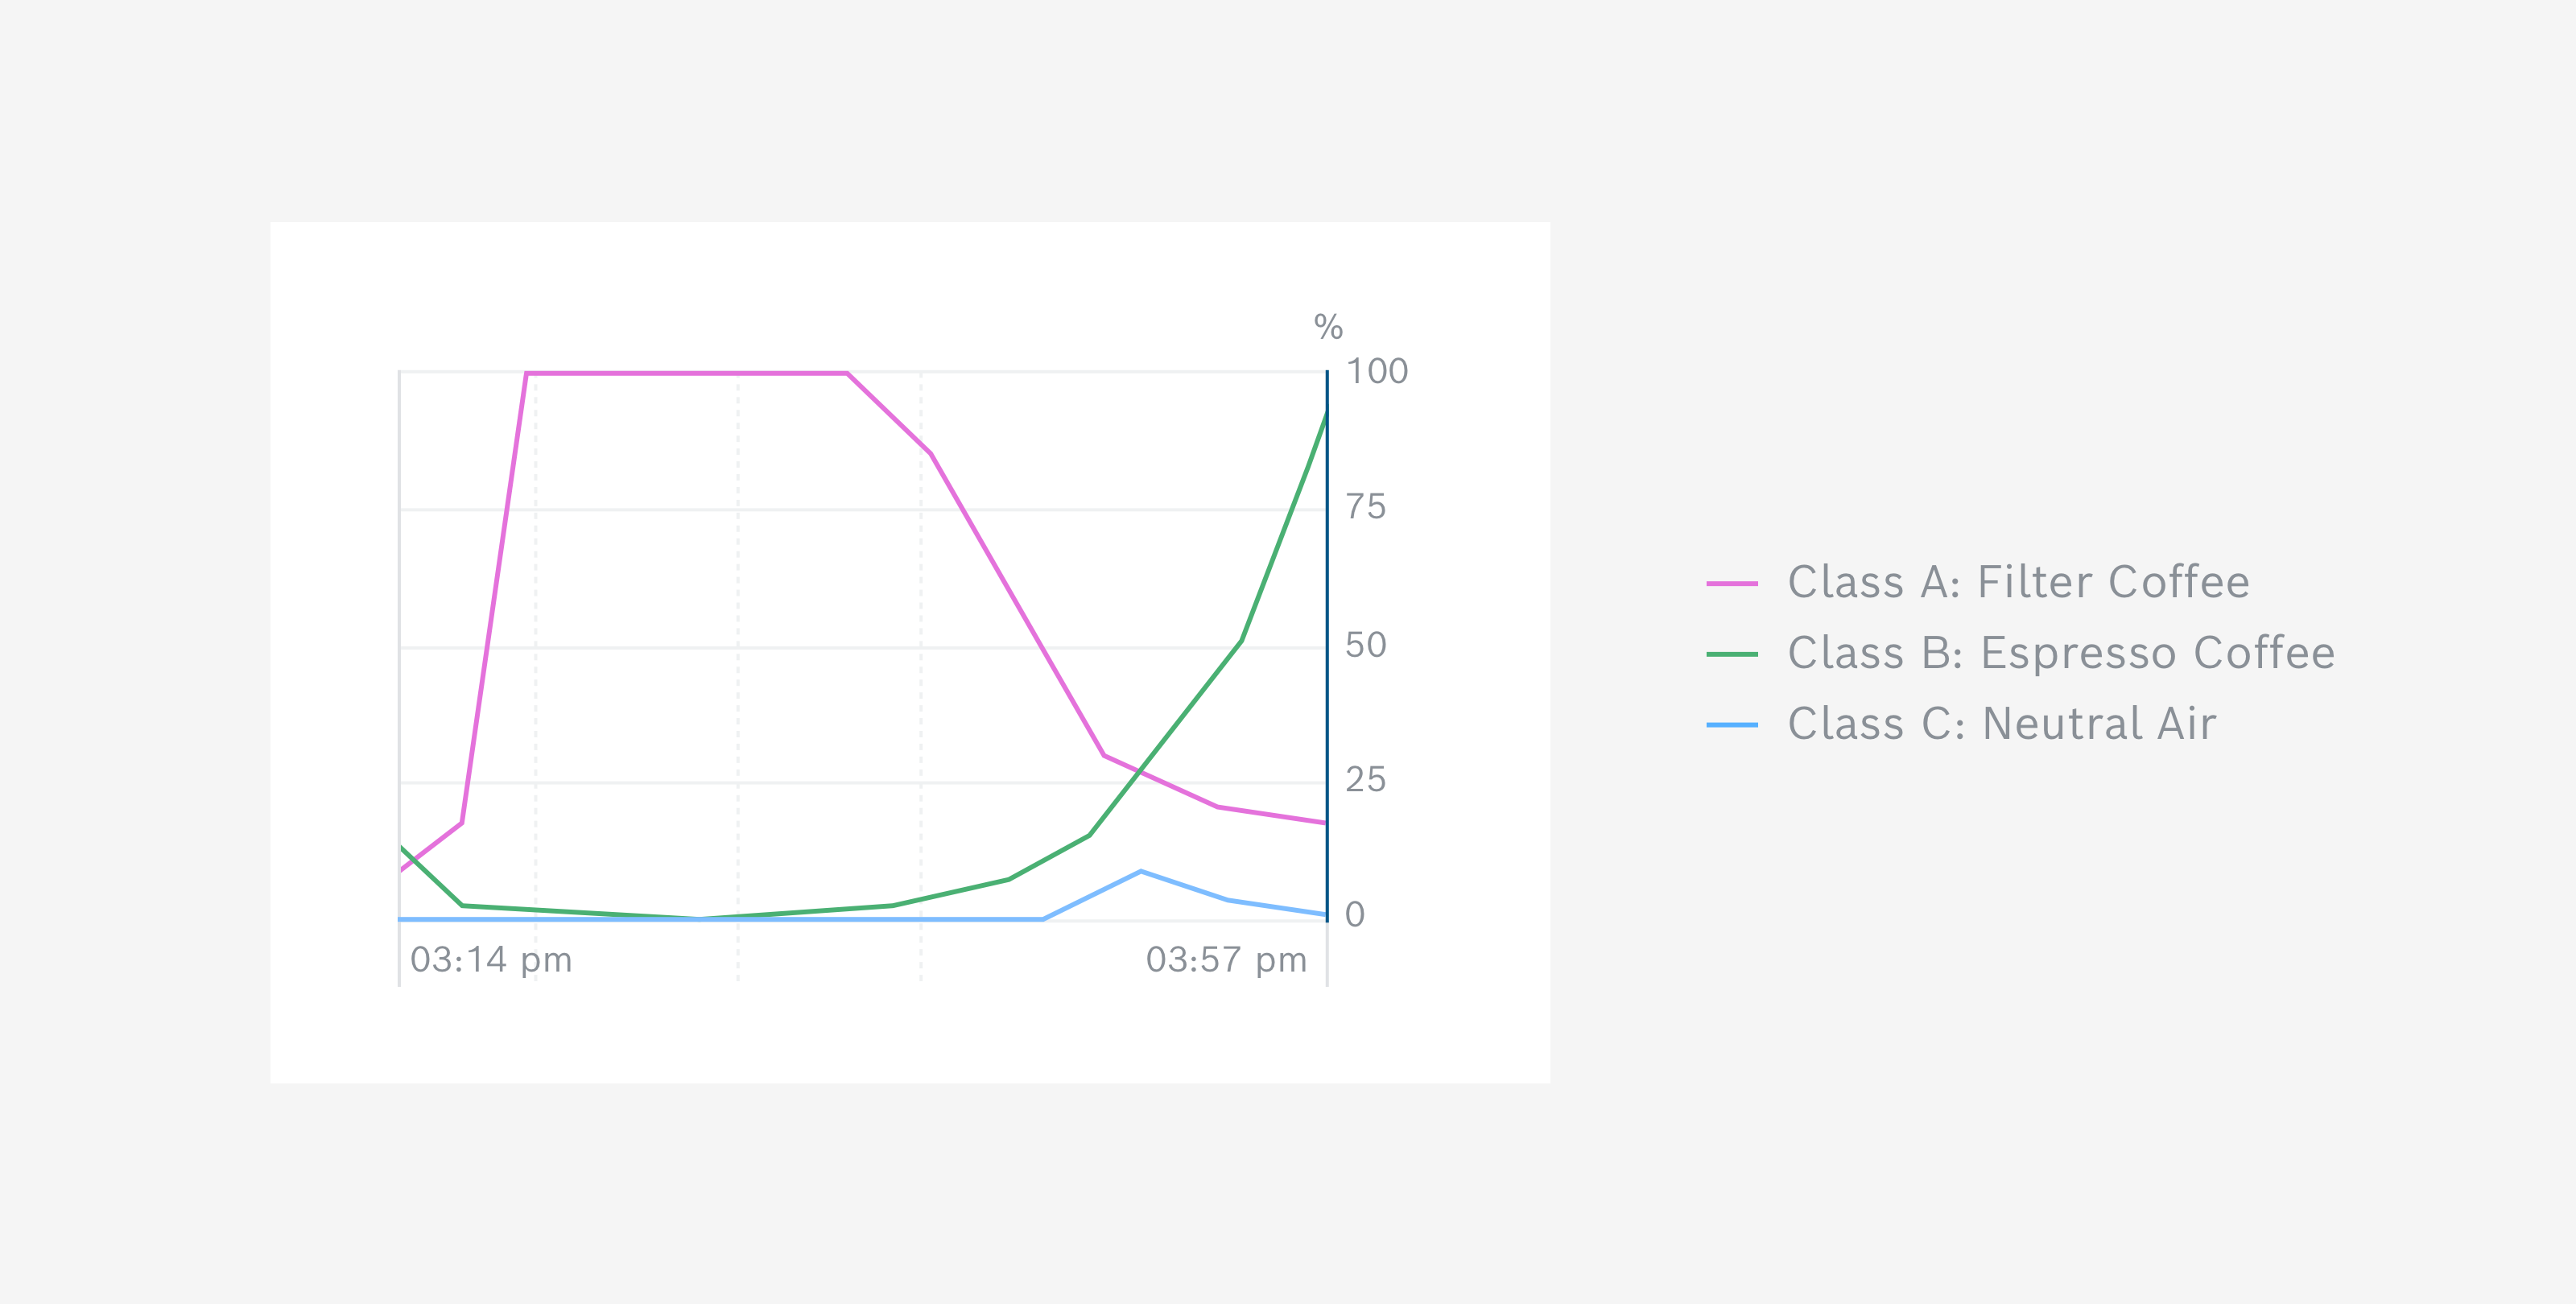
The Prediction Likeliness Graph shows the probability with which the classification algorithm predicted each class on a timeline. In other words each curve shows how certain the algorithm was with the prediction of each class.
For regression algorithms the app shows you for each gas sensor on the BME688 Development Kit:
- the used HP/RDC combination (Heater Profile and Duty Cycle), with current step indicator
- the currently predicted regression target value(s)
- the prediction history for each regression target on a timeline
- the recorded raw data (gas resistance data)
- the recorded environmental data (Temperature, humidity, pressure)
The Prediction History Graph shows which value the regression algorithm predicted for one target on a timeline. For each target, an individual prediction history graph is displayed.