III. Import Data
Overview
After you recorded data with the BME Board, it is now time to import the data into the application. During import, you can verify the data and define your Specimens. You can import several measurements and collect everything in your Specimen Collection, before later proceeding to train Algorithms. You can import data into a new project or into existing projects.
Access Files on SD Card
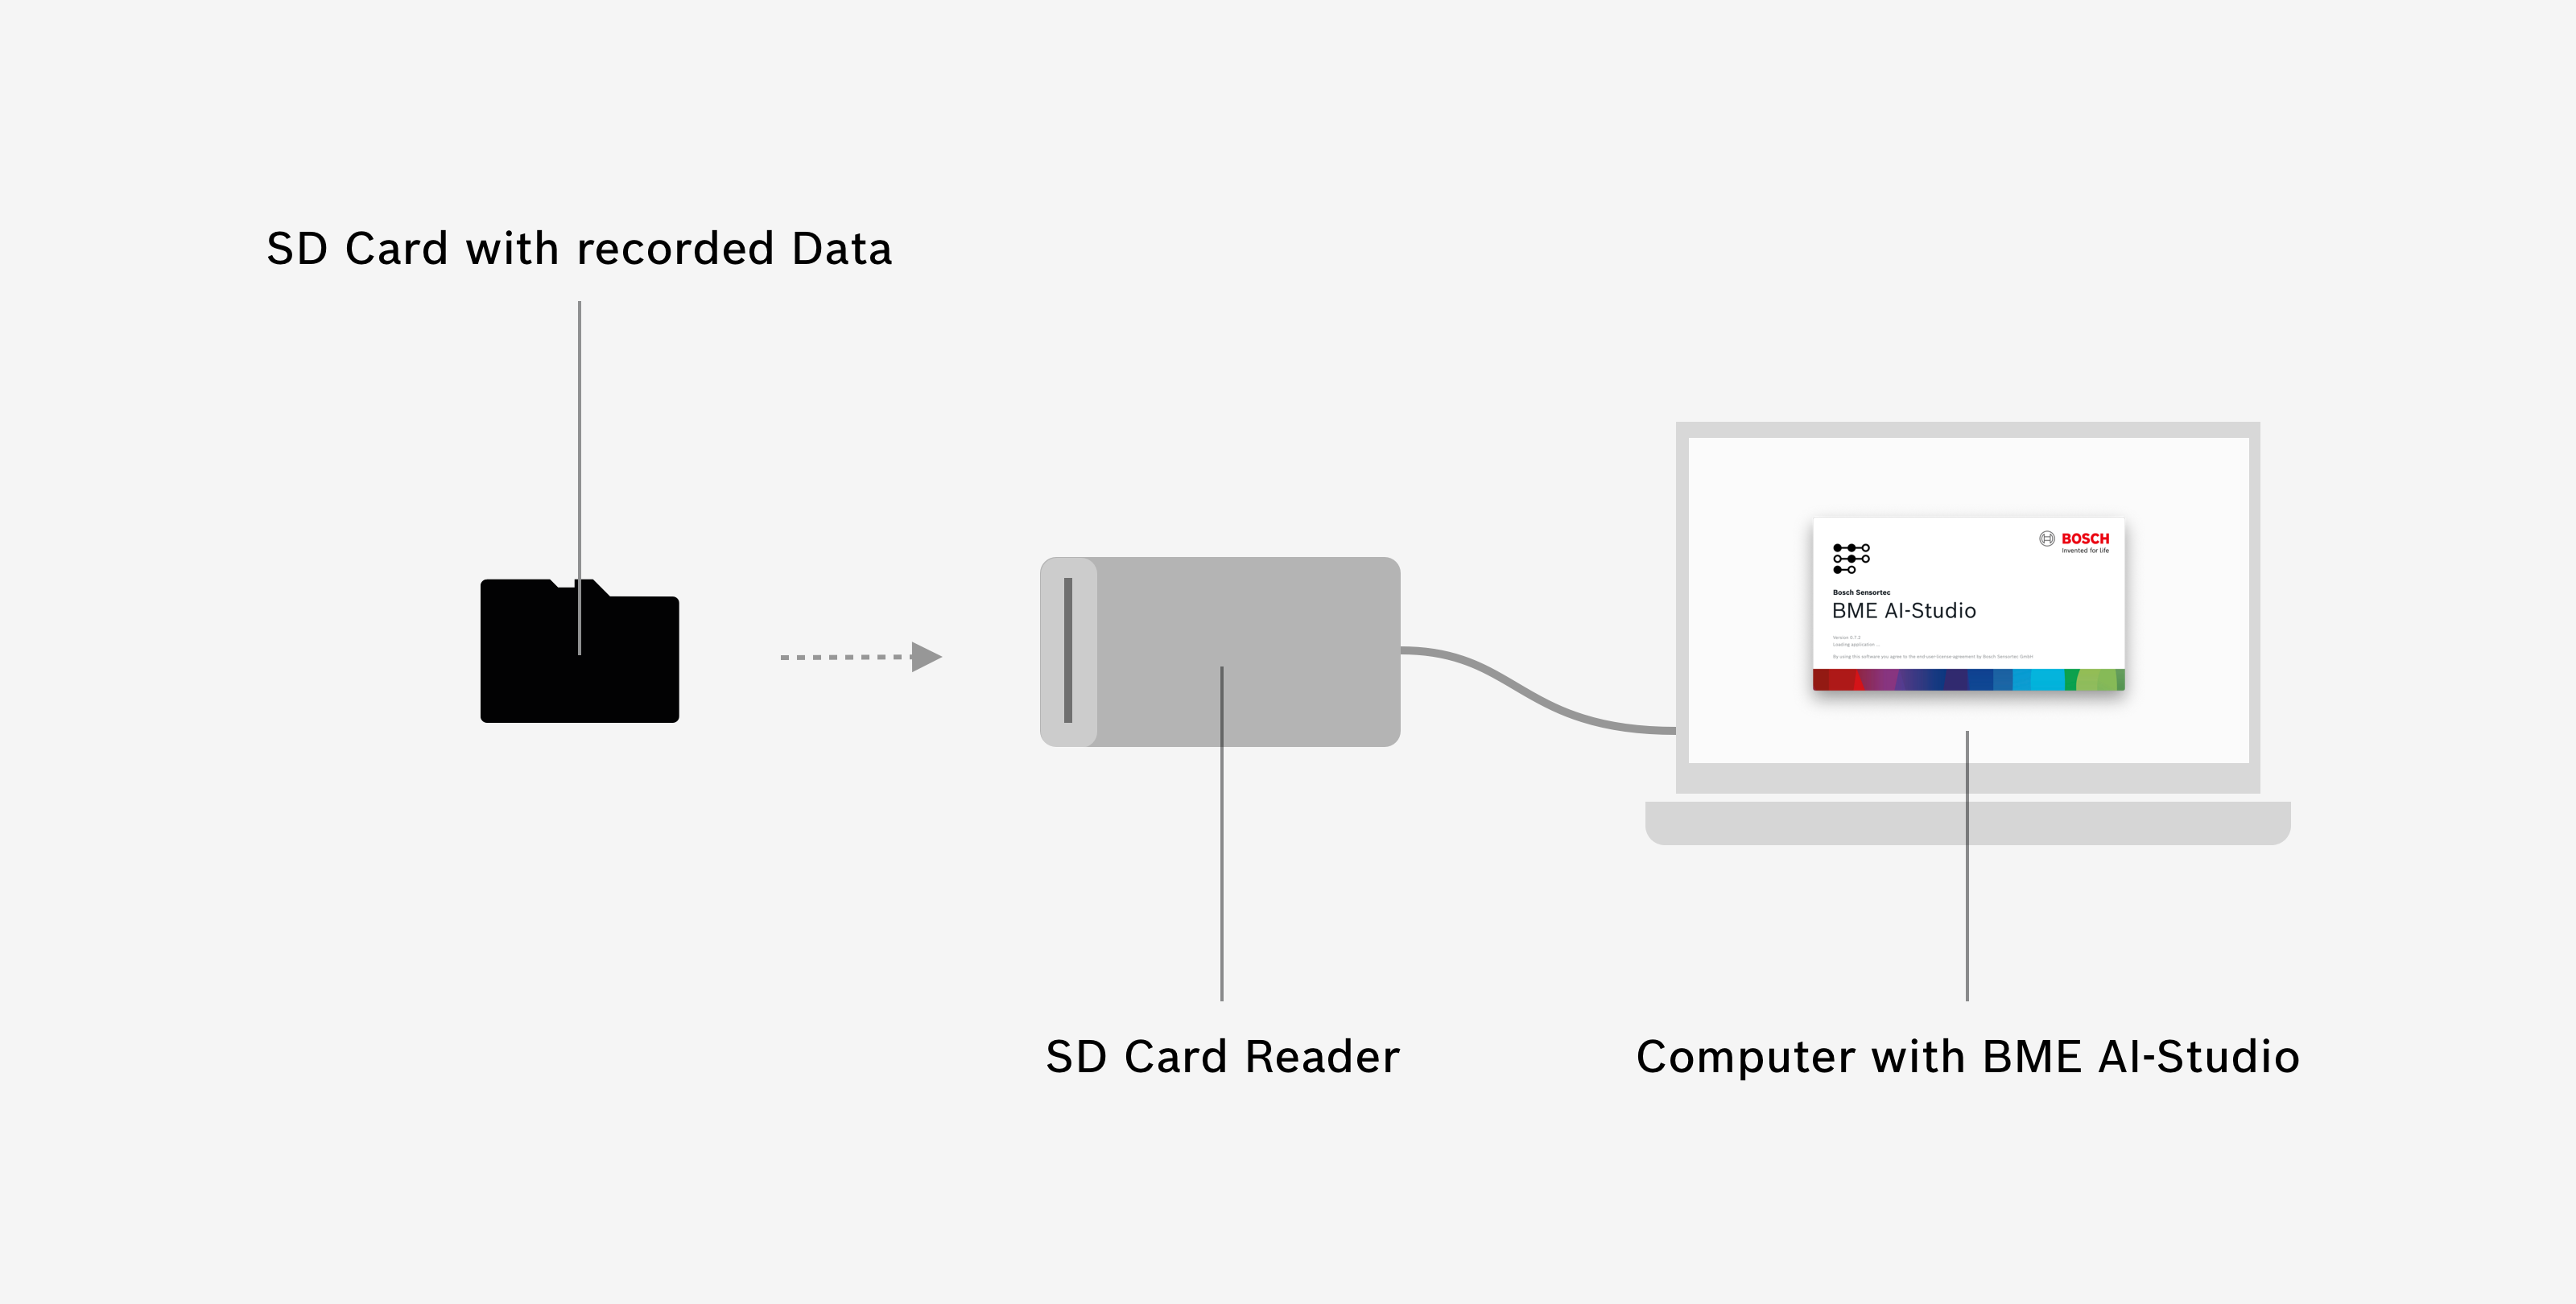
After your measurements, take the SD card out of the BME Board. Access the files on the SD card from your computer via an SD card reader.
Please note
If you do not see any data on the SD card, it is likely your board needs to be configured. To create a configuration file for your board, please see Configure Board.
Importing Raw Data
Open the application and create a new project by clicking Create new project on the Welcome screen. Alternatively, you can open the menu and select New project.... Next, a file dialogue opens. Please select, where you want to save your new project.
If you want to import data into an existing project, just open the project and switch to your Specimen Collection.
Now, to import data, click Import Data. A file dialogue opens. You can …
- select the Raw Data File directly from the SD card
- or first copy the Raw Data File from the SD card onto your computer hard drive, and then select the file from your hard drive.
Once you selected the Raw Data File, the data is being imported into your project and stored within the project folder of your project.
A new overlay opens that gives you an overview over the recorded data and lets you define your Specimens within the recording.
Importing Specimen Data
You can also import Specimen Data, that you exported from another project. The Specimens will be imported including their respective Measurement Sessions.
Please note
If you import Specimens that are already part of your project, the Specimens will imported as second duplicate. This can be interesting, if you want to weight specific Specimens as double or triple within algorithm training.
Importing whole projects
You can also import a whole project, by selecting the respective project folder. All Measurement Sessions and their Specimens will be imported.
Data Overview
This section gives you a brief summary of the data you just imported into your project. Verify the information to make sure everything went fine during your measurement:
Adjacent raw data files: If the data was automatically split into multiple parts during measurement, BME AI-Studio automatically recognizes all adjacent files and imports them as well, no matter if you choose the first or any other of these files. Automatic splitting of Raw Data files can happen when the BME Board power is switched on/off or the file limit (297 MB) is exceeded during measurement.
Number of sensors found within raw data: This number should correspond with the number of sensors on the BME Board used to record the data. If you used the BME688 Development Kit, which has eight sensors, the imported Raw Data should include data from eight sensors as well. However, in some cases the number of sensors found within the data does not match with the number of sensors on the board. This usually indicates that one or more sensors were malfunctioning or not recording any data for some reason.
Number of HP/RDC Combinations found within raw data: This number should correspond with the specific BME Board Configuration used to record the data. E.g. if your configuration included four Heater Profiles and one Duty Cycle (so 4 HP/RDC Combinations in total), the imported Raw Data should include data from four HP/RDC Combinations as well. However, in some cases the number of HP/RDC Combinations found within the data does not match with the original BME Board Configuration. This usually indicates that one or more sensors were malfunctioning or not recording any data for some reason.
Board ID
This indicates which BME Board has been used to record the data. Each board has a unique ID that is permanently stored on the board itself, which makes it uniquely identifiable.
Board Type
This indicates the type of BME Board used to record the data.
Board Mode
This indicates the Board Mode in which the BME Board was configured in when used to record the data.
Session Name
Give your Measurement Session a name – this could be a topic, a specific location or special occasion. Choose your Session name in a way that helps you identify and distinguish your Measurement Session later on.
Session Date
This indicates the date and time the Measurement Session has been recorded. Within the Raw Data, the time information is stored in Coordinated Universal Time (UTC) and is here automatically displayed in your respective local time zone. You can manually overwrite the time information if needed.
Start Date
The time the BME Board was powered on.
End Date
The time the BME Board was powered off.
Please note
If your BME688 Development Kit lost its time information (e.g. if you disconnected the battery), the date and time of the Measurement Session will always be January 1, 1970 by default. In this case, please overwrite the date and time with the actual correct date and time of your measurement.
Specimen Data
This section gives you a visual representation (data plot) of the Measurement Raw Data and an overview of the Specimens defined within this session.
Specimens within a Measurement Session reflect what you have measured during that session. This can be an object, a specific situation, a smell, gas, etc. – or in other words: One specific gas composition the sensors on the BME Board were exposed to during the measurement.
Defined Specimens are shown in the data plot as well as a list below.
Data Plot
You can view the Specimen Data in a visual plot. You can switch or choose between:
- different sensors on the BME Board
- different Data Channels
Gas Data ChannelHumidity Data ChannelTemperature Data ChannelBarometric Pressure Data Channel
- different zoom levels using
+and-or reset the zoom level usingReset - different zoom sections using the small navigation bar underneath the main graph
Good to know: Gas Data Channel
The 10 lines which are displayed in "Gas Data Channel" represent the so called quasi-static points corresponding to the 10 Heater Profile Step Index. This means that each line follows the time evolution of a measuring point of the Heater Profile.
You may notice that the data in the "Gas Data Channel" is truncated at a value of 102400000. This is normal behavior (referred to as clipping) that does not affect data quality or the performance of the algorithms derived from it.
Define Specimens
During measurement via on-board buttons
During measurement you can use the two buttons on the BME688 Development Kit to mark specific moments as a new Specimen. If you did, these Specimen definitions will appear in here this section (in the data plot and in the list of Specimens below). See II. Record Data for further details.
During measurement via BME AI-Studio Mobile App
You can also use the BME AI-Studio Mobile App to label your data during recording. For information, please see Mobile App.
Manually during data import
You can also add new Specimen definitions manually during import by clicking Add Specimen. This creates a new Specimen definition in the list and you can specify the respective start and end time within the Measurement Session. You can also add the corresponding Label here. The order of the Specimens is of no importance - Specimens can be created by the user in any order.
Edit Specimens
Labels
You can label your recorded Specimens either here during Import, or later within the Specimen Collection (see IV. Collect Specimens).
Timings
You can edit the start and end time of Specimen definitions manually. When editing a Specimen definition, the respective area is highlighted in the data plot above.
Good to know
Although it is possible to define “overlapping” Specimens within a Session where the end time of the first Specimen lies after the start time of the second Specimen (so the same data is used in two Specimens), we recommend not doing so.
Please note
The start and end time of Specimens can not exceed the start and end time of the overall session.
You can also use the interactive graph to edit start and end timings of a selected Specimen, by clicking and dragging on one of the two sides of the Specimens bounding box.
Zoom to a specific Specimen
You can zoom to a Specimen using the little eye-Symbol next to the Specimen.
Delete a Specimen definition
You can easily delete a Specimen definition by clicking the X button.